Texas Manufactured Home Shipments in March 2025
March Shipments
Manufactured home shipments to Texas retailers in March moved down a seasonally-adjusted -4.4% from the previous month. The 1,498 total homes shipped for the month was on the low side of the forecast and was down -4.2% from March of 2024. Multi-section home shipments were up again this month coming in +7.8% over 2024’s total but single-sections were down -19.2%
| Shipments | Singles | Multis | Total |
|---|---|---|---|
| Total for March: | 563 | 935 | 1,498 |
| Change from February (Raw %): | -3.3% | 8.8% | 4% |
| Change from February (Raw Units): | -19 | 76 | 57 |
| Change from February (SA %): | -7.6% | -2.6% | -4.4% |
| Change from March of 2024 (%): | -19.2% | 7.8% | -4.2% |
| Change from March of 2024 (Units): | -134 | 68 | -66 |
March Production
Texas manufactured housing plant production expanded in March moving up a seasonally-adjusted +1.2% over February, confirming the Texas Manufactured Housing Survey’s indication of a slight increase in run rates for the month. The 1,948 homes produced was on the high side of the total home forecast but was -0.8% below March of 2024. The year-over-year decrease in total homes was due to the product mix shift towards more multi-section homes as the floor data was up both from the previous month and year-over-year.
The run rates for both total homes and floors moved up from February as production expanded.
| Texas Plant Production | Total | Shipped Out of TX | Min Floors |
|---|---|---|---|
| Total for March: | 1,948 | 546 | 2,815 |
| Change from February (Raw %): | 7.5% | 18.2% | 8.1% |
| Change from February (Raw Units): | 136 | 84 | 210 |
| Change from February (SA %): | 1.2% | NA | 1.3% |
| Change from March of 2024 (%): | -0.8% | 7.5% | 1.8% |
| Change from March of 2024 (Units): | -15 | 38 | 50 |
April Outlook
The forecasting models have April shipments at 1,518 (+/- 211) and Texas factory production at 2,007 (+/- 225) homes.
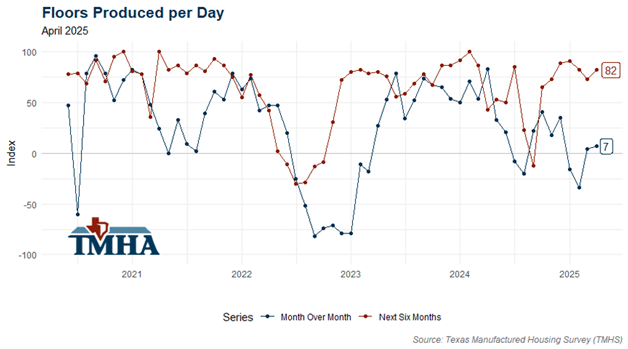
The Texas Manufactured Housing Survey (TMHS) for April has run rates moving slightly higher and out-of-state shipments moving lower, so take the over on shipments but production is a coin flip.
Annual Totals
The shipment total for the year is currently -1.7% below 2024 while Texas plant production is down just -0.4% for total homes but up +3.1% for number of floors as single-section demand remains soft.
The forecast for annual Texas shipments in 2025 moved down to 17,261 (+/- 2,441) and forecasted Texas plant production moved down to 23,100 (+/- 2,747).
| Shipments | Singles | Multis | Total |
|---|---|---|---|
| Total for 2025 YTD: | 1,751 | 2,711 | 4,462 |
| Change from 2024 (%): | -17.6% | 12.3% | -1.7% |
| Change from 2024 (Units): | -373 | 297 | -76 |
| Texas Plant Production | Total | Shipped Out of TX | Min Floors |
|---|---|---|---|
| Total for 2025 YTD: | 5,687 | 1,519 | 8,190 |
| Change from 2024 (%): | -0.4% | 3.9% | 3.1% |
| Change from 2024 (Units): | -25 | 57 | 249 |
Charts
January 2025 appears to be the 12-month moving average peak for shipments this production cycle.