Texas Manufactured Housing Market Report March 2026 - Sales Data & Analysis
Rob Ripperda
March
Early Look
New manufactured home sales for March 2026 titled to date are so far down a seasonally-adjusted 4.4% from the previous month but are running 14.6% above March of 2025 as the titling shift that has been underway since August of 2025 continues to inflate year-over-year numbers. Some home sales that would have previously been titled with an earlier purchase contract date a year ago are now getting titled with a later date of when the change in ownership ultimately occurred.
Until we get through the summer of 2026, year-over-year numbers should remain high, especially for the early look.
As you can see in the plot below the early March sales counts are running above the previous year due to the titling cadence change. The shift will add noise to the seasonal-adjustments, but they’re still one of our best gauges on the health of the retail market.
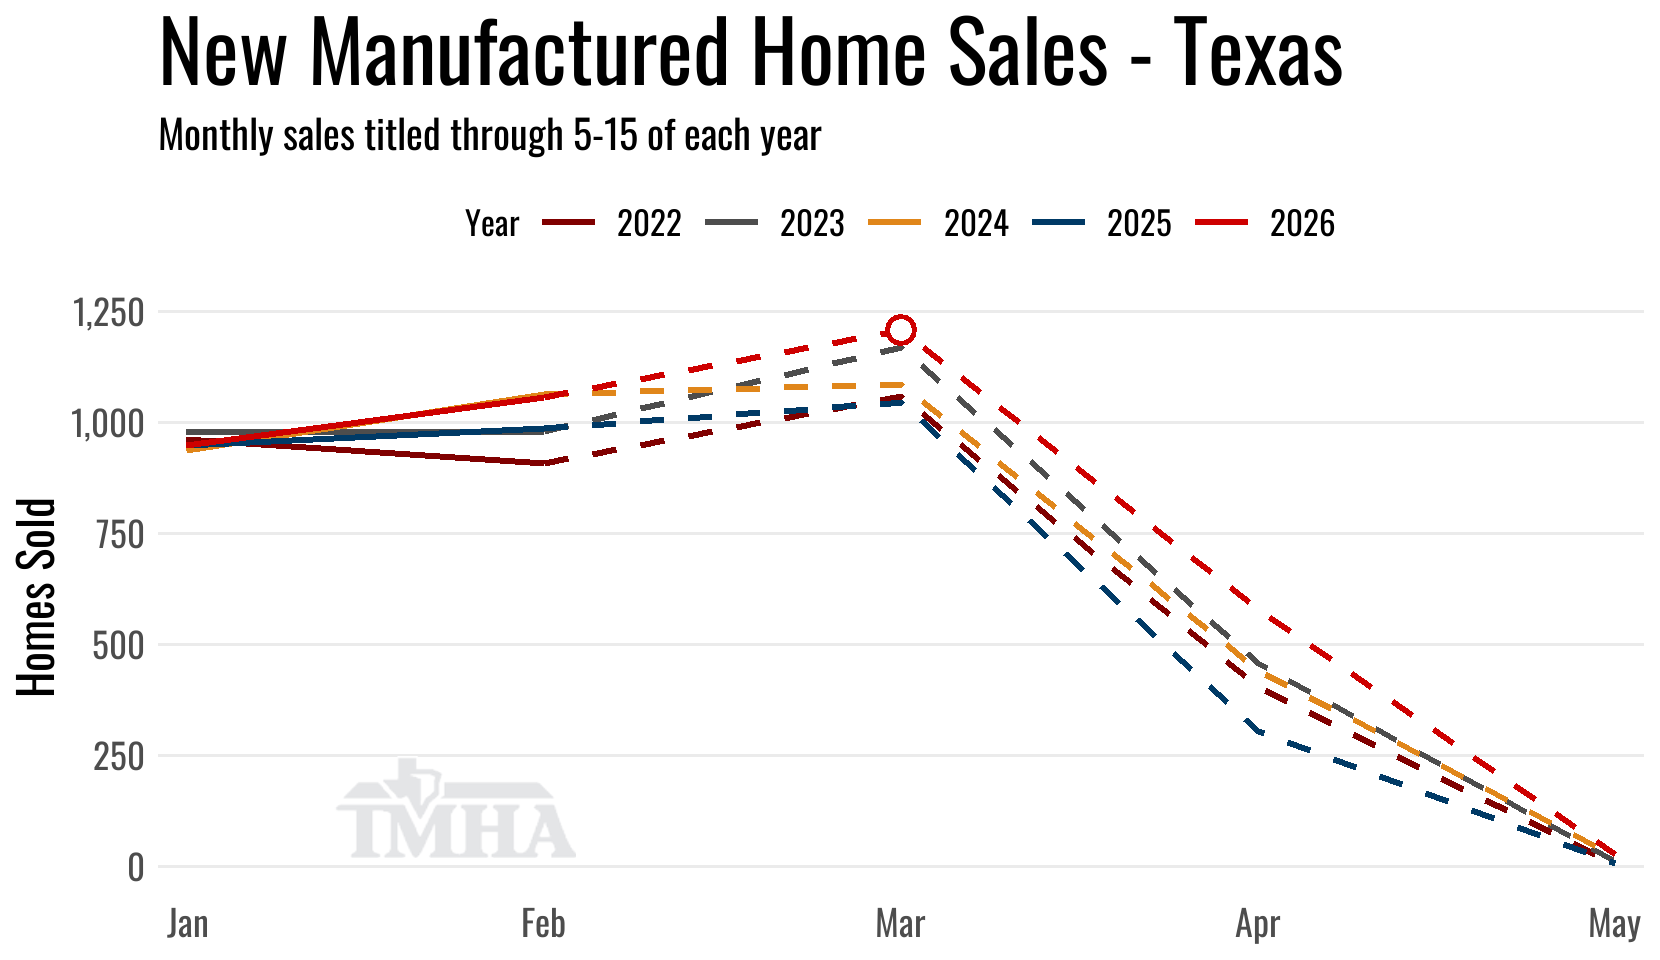
Solid lines represent months for which the on-time titling window has closed. Dashed lines are preliminary months for which titles are still being counted toward the reported total.
The comparisons in the table below are based on where the previous month’s numbers were when originally reported on one month ago.
| New Sales | Singles | Multis | Total |
|---|---|---|---|
| Total for March: | 464 | 745 | 1,209 |
| Change from February (Raw %): | 29.6% | 28.4% | 28.9% |
| Change from February (Raw Units): | 106 | 165 | 271 |
| Change from February (SA %): | 1% | -8.3% | -4.4% |
| Change from March of 2025 (%): | 5% | 21.5% | 14.6% |
| Change from March of 2025 (Units): | 22 | 132 | 154 |
TMHA Member’s Retailer Annual Sales Totals Report
February
Titled on Time
New home sales for February titled to date were up a seasonally adjusted 1.8% from the previous month and are up 7.1% on the raw total from February of 2025.
The seasonally-adjusted December total was a series record for the data we’ve been tracking since 2012, as the cadence shift concentrated sales that would previously have been revised into earlier months of 2025 into December instead. January pulled back sharply from that record, but February posted a modest seasonally-adjusted recovery.
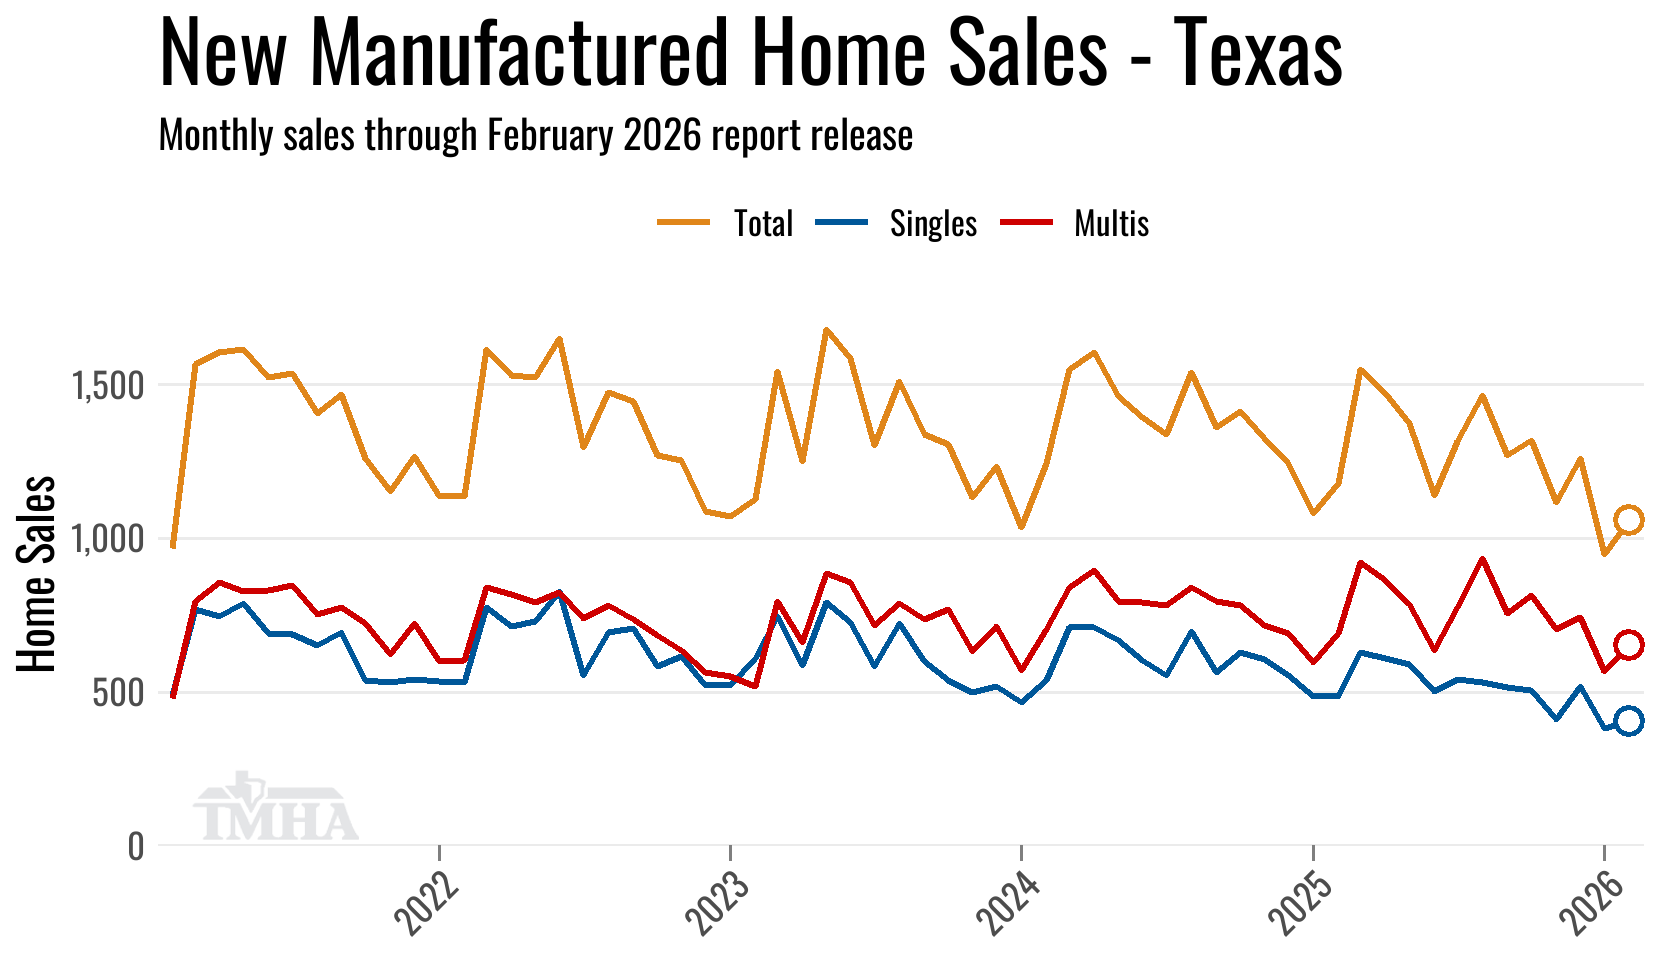
While the plot above contains revised totals for previous months the comparisons in the table below are based on where the previous month’s numbers were when released one month ago.
| New Sales | Singles | Multis | Total |
|---|---|---|---|
| Total for February: | 405 | 653 | 1,058 |
| Change from January (Raw %): | 8.3% | 18.1% | 14.1% |
| Change from January (Raw Units): | 31 | 100 | 131 |
| Change from January (SA %): | 0.1% | 3.5% | 1.8% |
| Change from February of 2025 (%): | -1.2% | 13% | 7.1% |
| Change from February of 2025 (Units): | -5 | 75 | 70 |
TMHA Member’s Retailer Monthly Sales Totals Report
Installation Location Trends
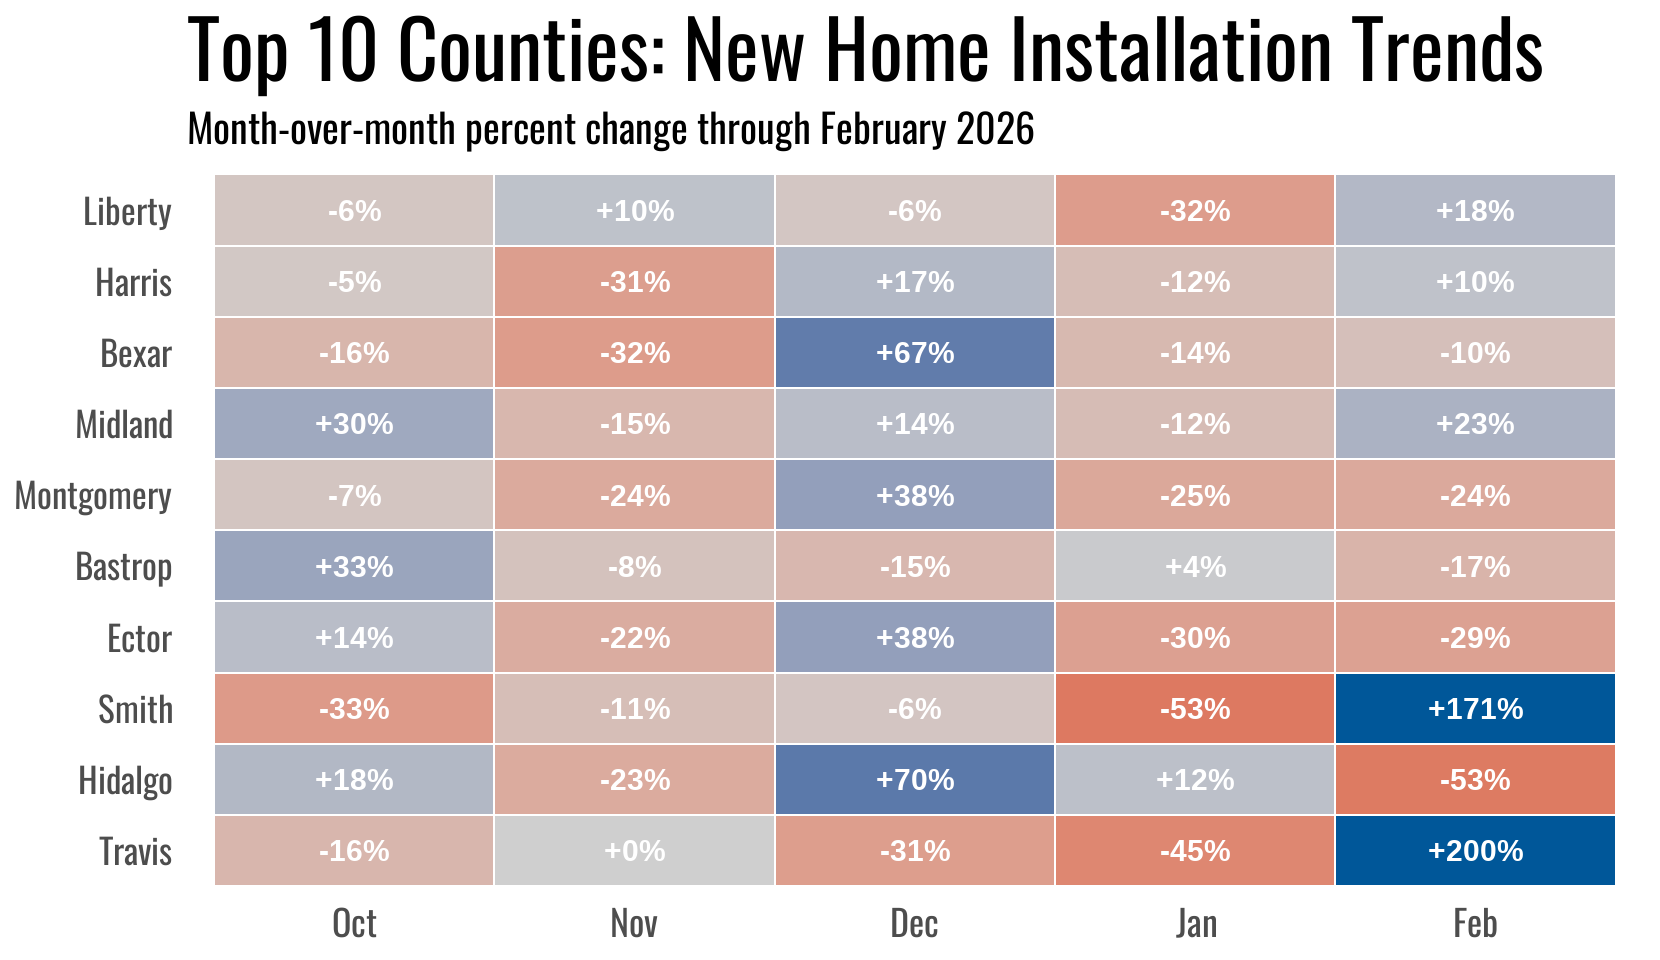
Here are the month-over-month changes for the top 10 counties for new home sales in February and their sequential changes over the previous four months.
Five of the top ten counties posted month-over-month gains in February. Smith and Travis led with 12-unit increases each, while Midland added 5, Liberty 6, and Harris 3. Hidalgo saw the largest pullback, falling 20 units from January.
TMHA Member’s Retailer Annual Sales Total per County Report
Annual Totals
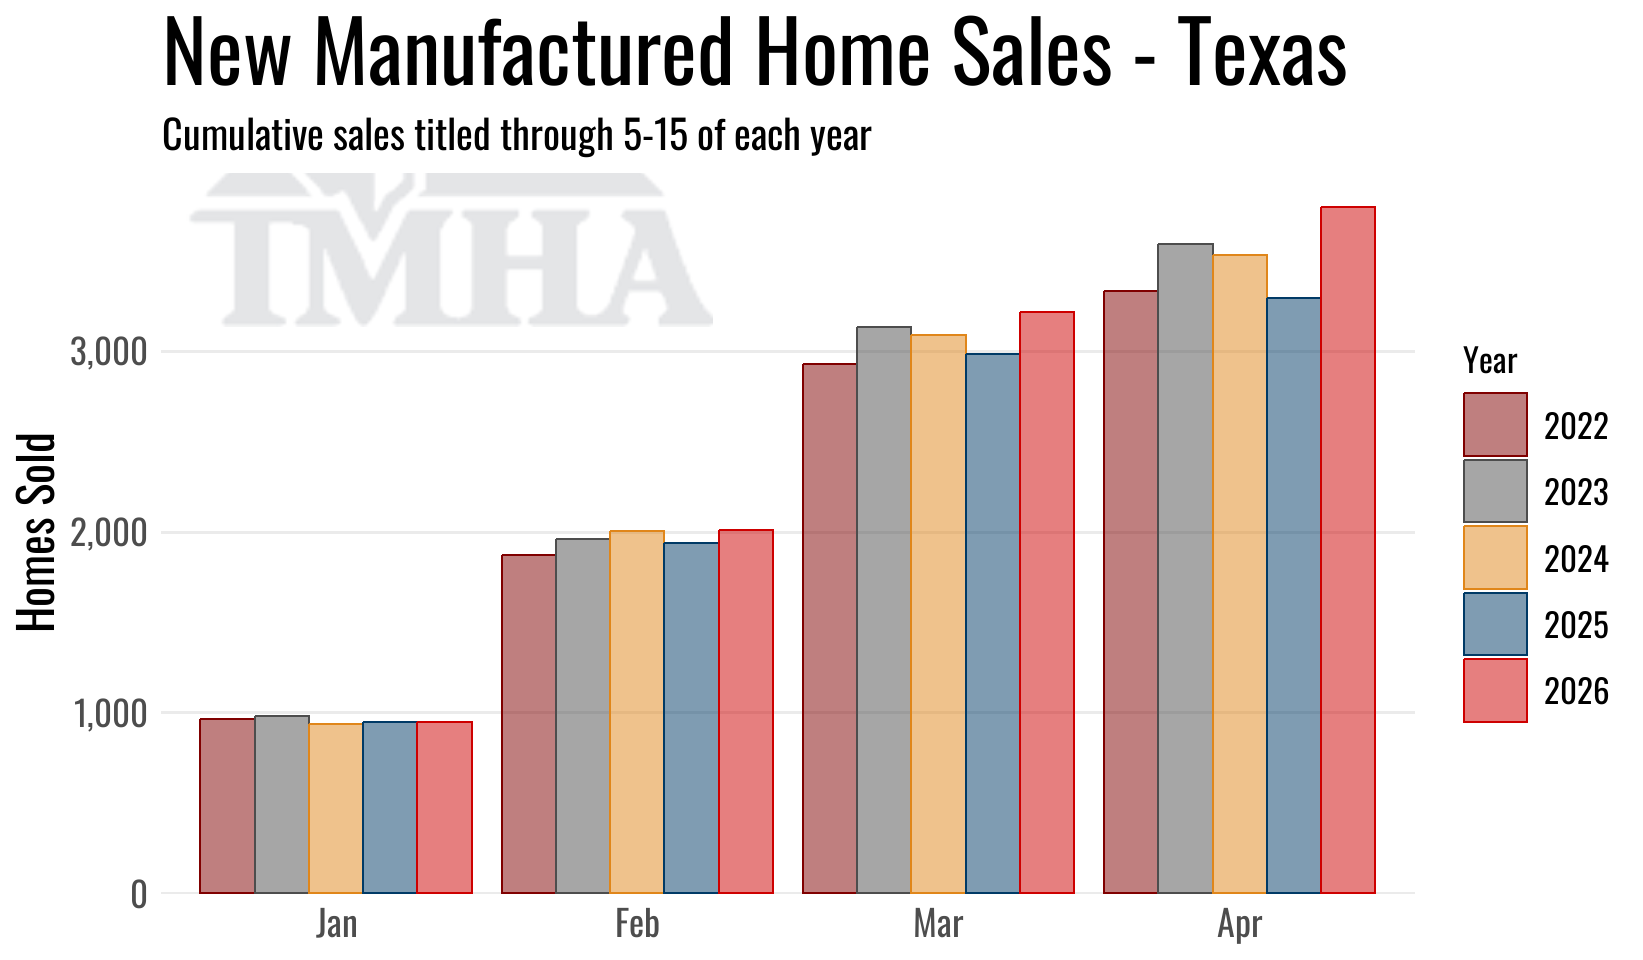
New home sales in 2026 are showing a 16% gain year-over-year through February compared to the same point in 2025.
Multi-section sales are up 25.1% year-over-year while single-section sales are up 3.8%.
As noted above, the titling phase shift continues to inflate 2026 year-over-year comparisons, particularly early in the year when the prior-year base is least affected by the shift.
| New Sales | Singles | Multis | Total |
|---|---|---|---|
| Total for 2026 titled to date: | 1,464 | 2,359 | 3,823 |
| Change from 2025 (%): | 3.8% | 25.1% | 16% |
| Change from 2025 (Units): | 53 | 473 | 526 |
TMHA Member’s Retailer Annual Sales Totals Report
New Home Characteristics
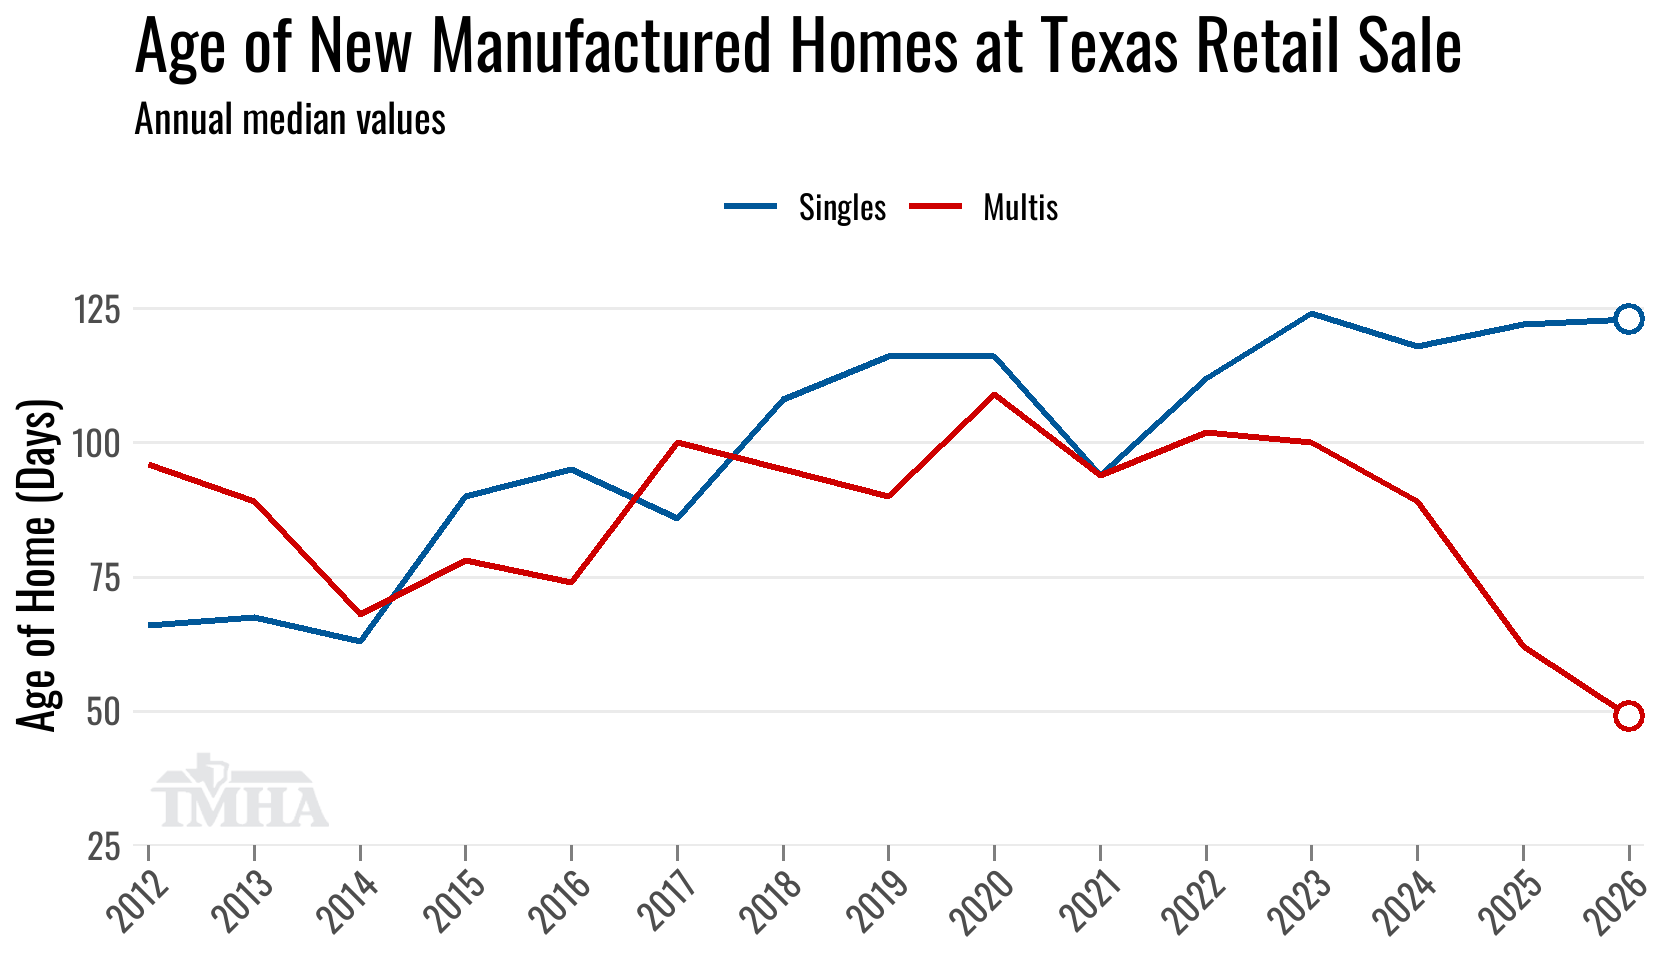
The shift in title cadence has really pulled down the median age of multi-section homes to the shortest amount of days in our records, yet the same dynamic hasn’t carried over to single-section homes, whose median age remains near its 2023 peak.
| New Home Characteristics for 2026 | Singles | Multis | Total |
|---|---|---|---|
| Median Age of Home (Days): | 123 | 49 | 72 |
| Median Square Footage: | 1,080 | 1,736 | 1,475 |
New Home Placement Locations
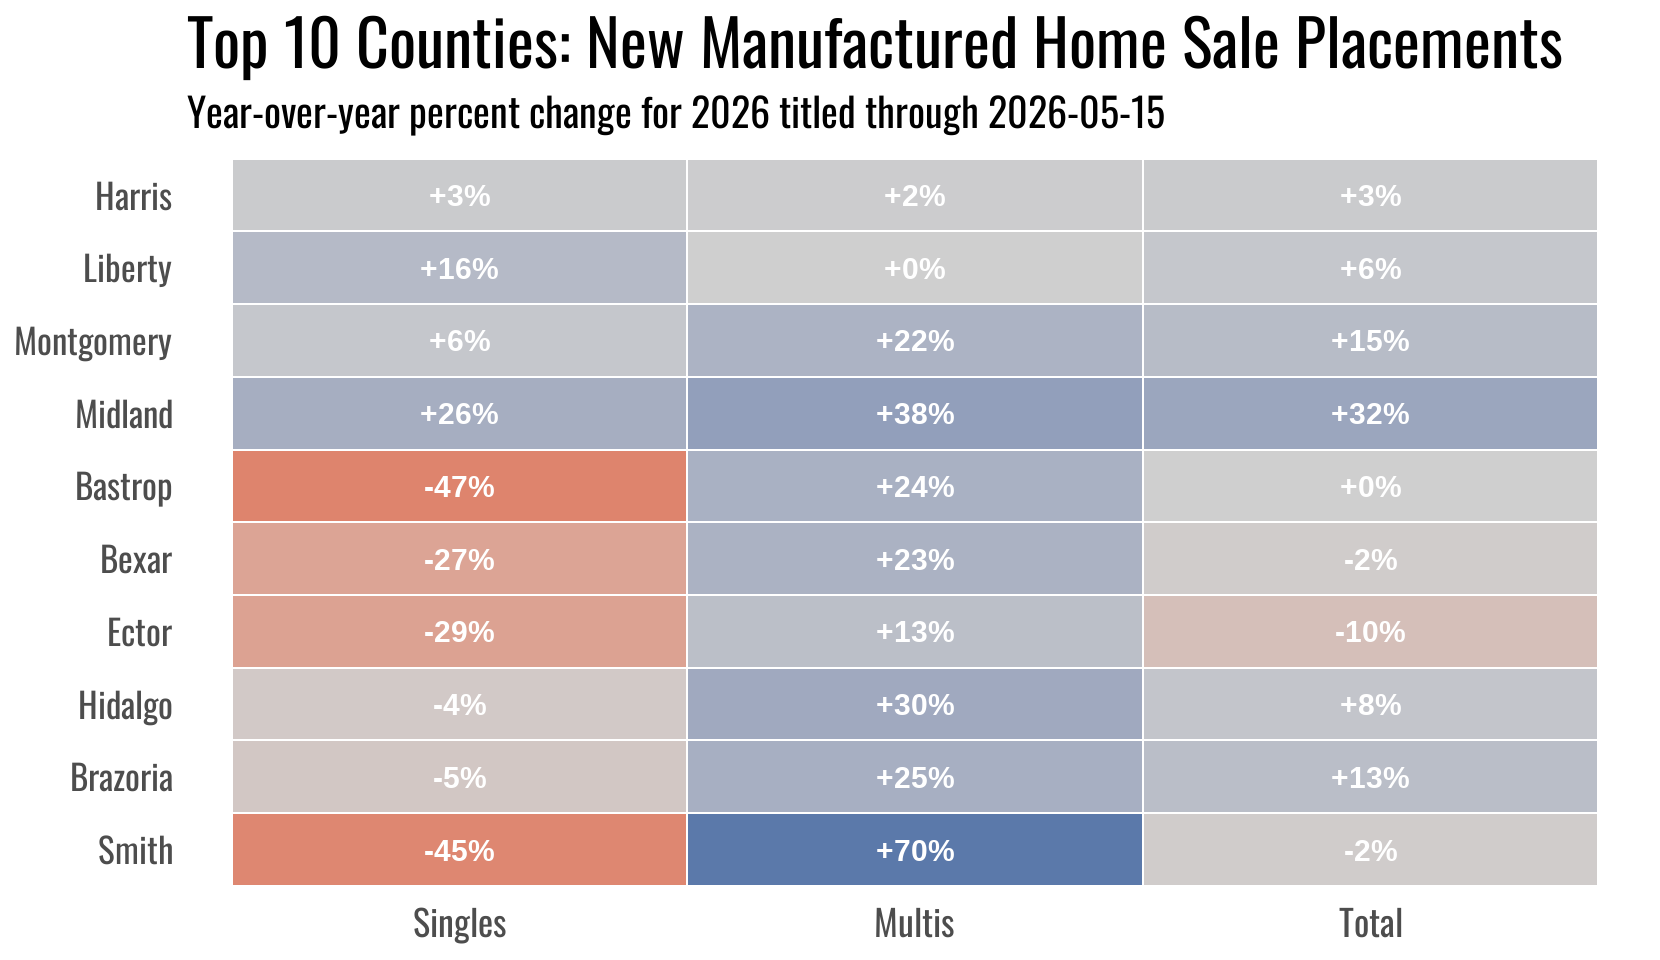
Here are the breakdowns in year-over-year changes for the top 10 counties in new home placements across home section types.
Midland at number four leads the top 10 in year-over-year growth at +32.5%, followed by Montgomery at number three up 15% and Brazoria at number nine up 13.5%. Ector and Smith are the only two counties in the top 10 showing year-over-year declines.
TMHA Member’s Total Annual Retail Sales per County Report
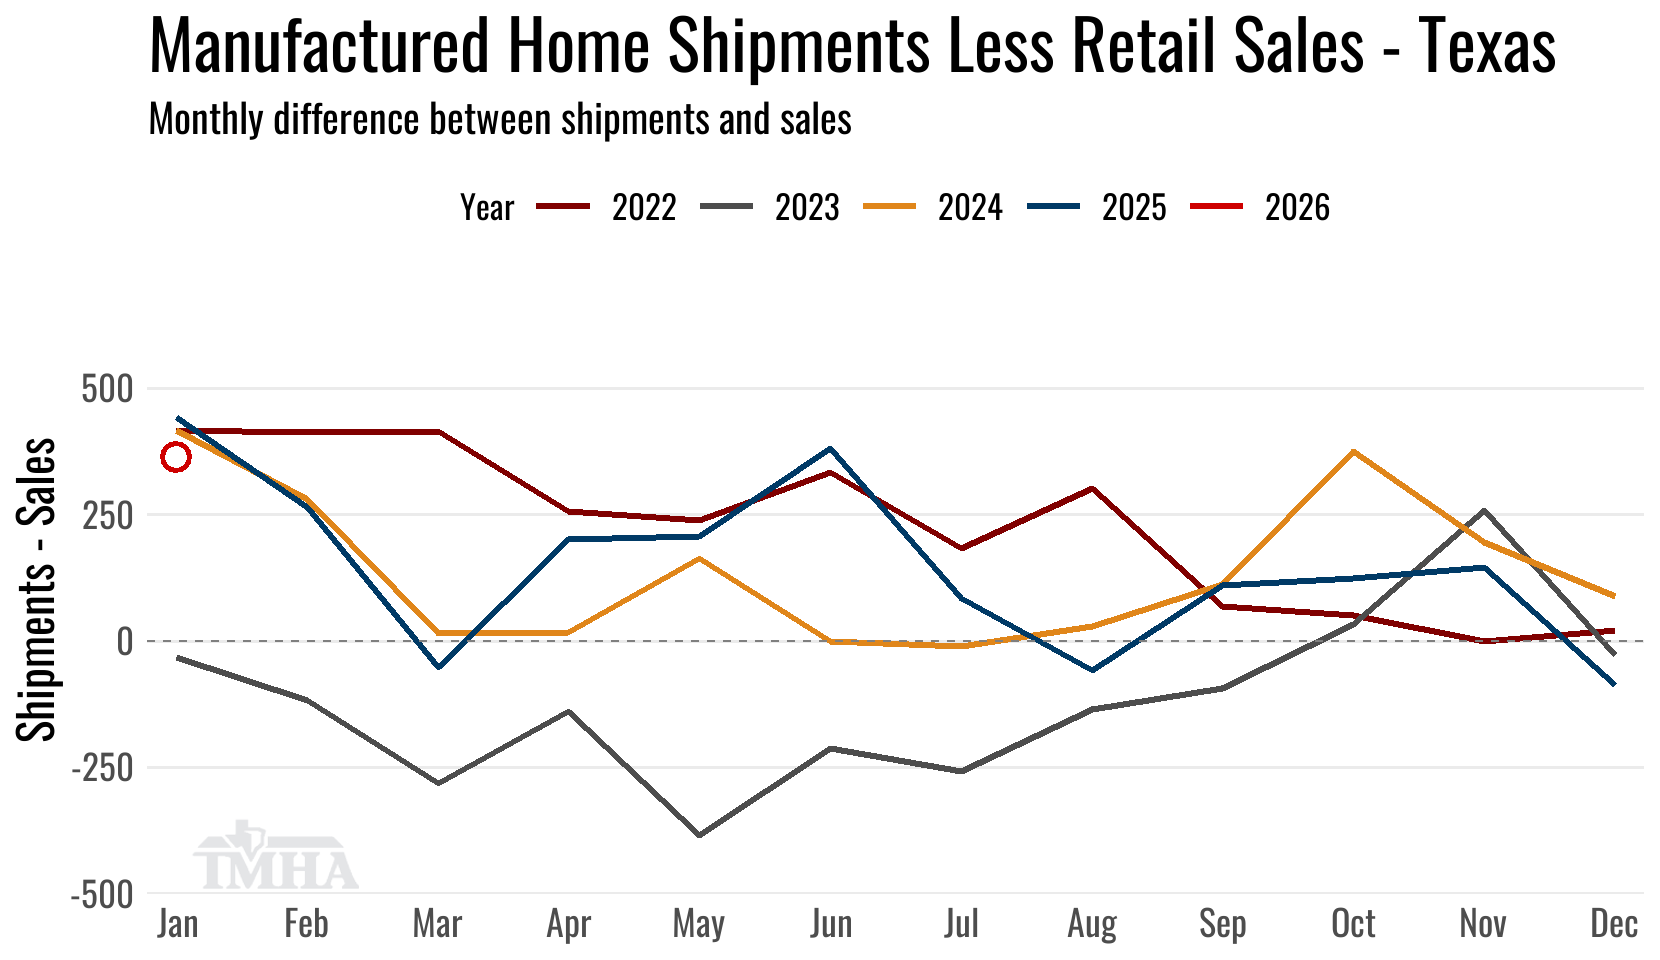
Shipment Comparison
The last third of 2025 was mostly a period of aggregate inventory buildup, although the robust retail sales of December did pull shipments less sales into negative territory for that month. The shallowness of the three months of inventory contraction in 2025 will be a headwind for shipments in 2026.
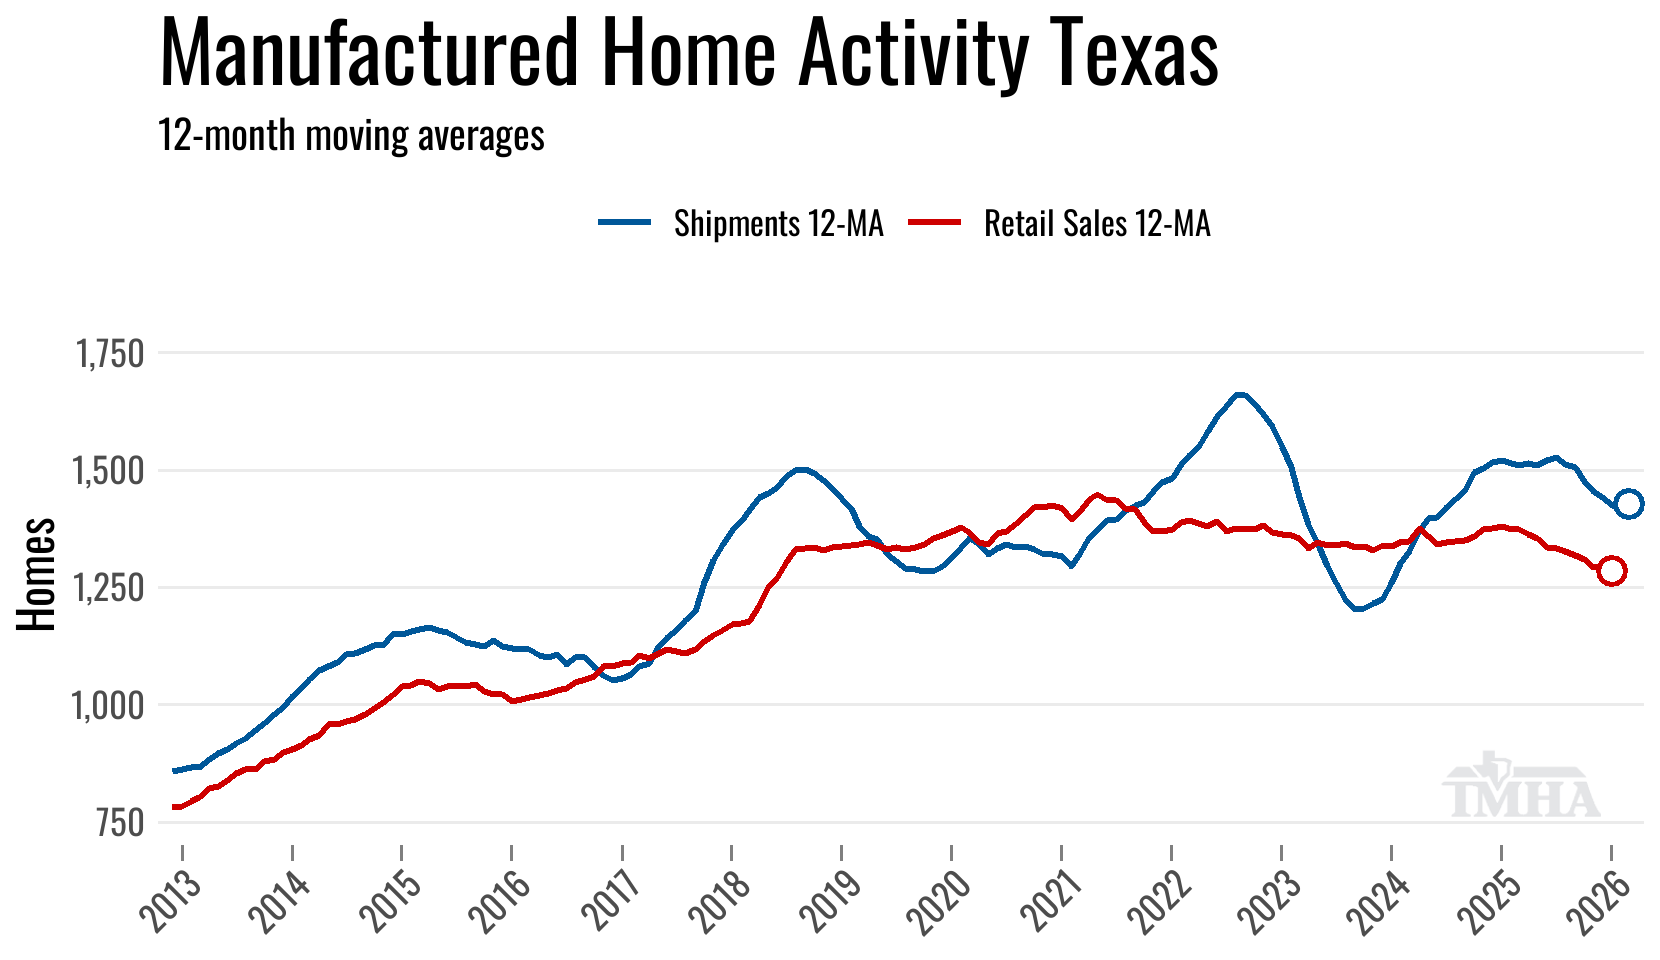
Moving Averages
The 12-month moving average for shipments peaked in July of 2025 for this last production expansion cycle and had been moving lower until March 2026.
The 12-month moving average for retail sales is currently plotted through January 2026. Until that retail sales line starts moving up, shipments will continue to face headwinds.
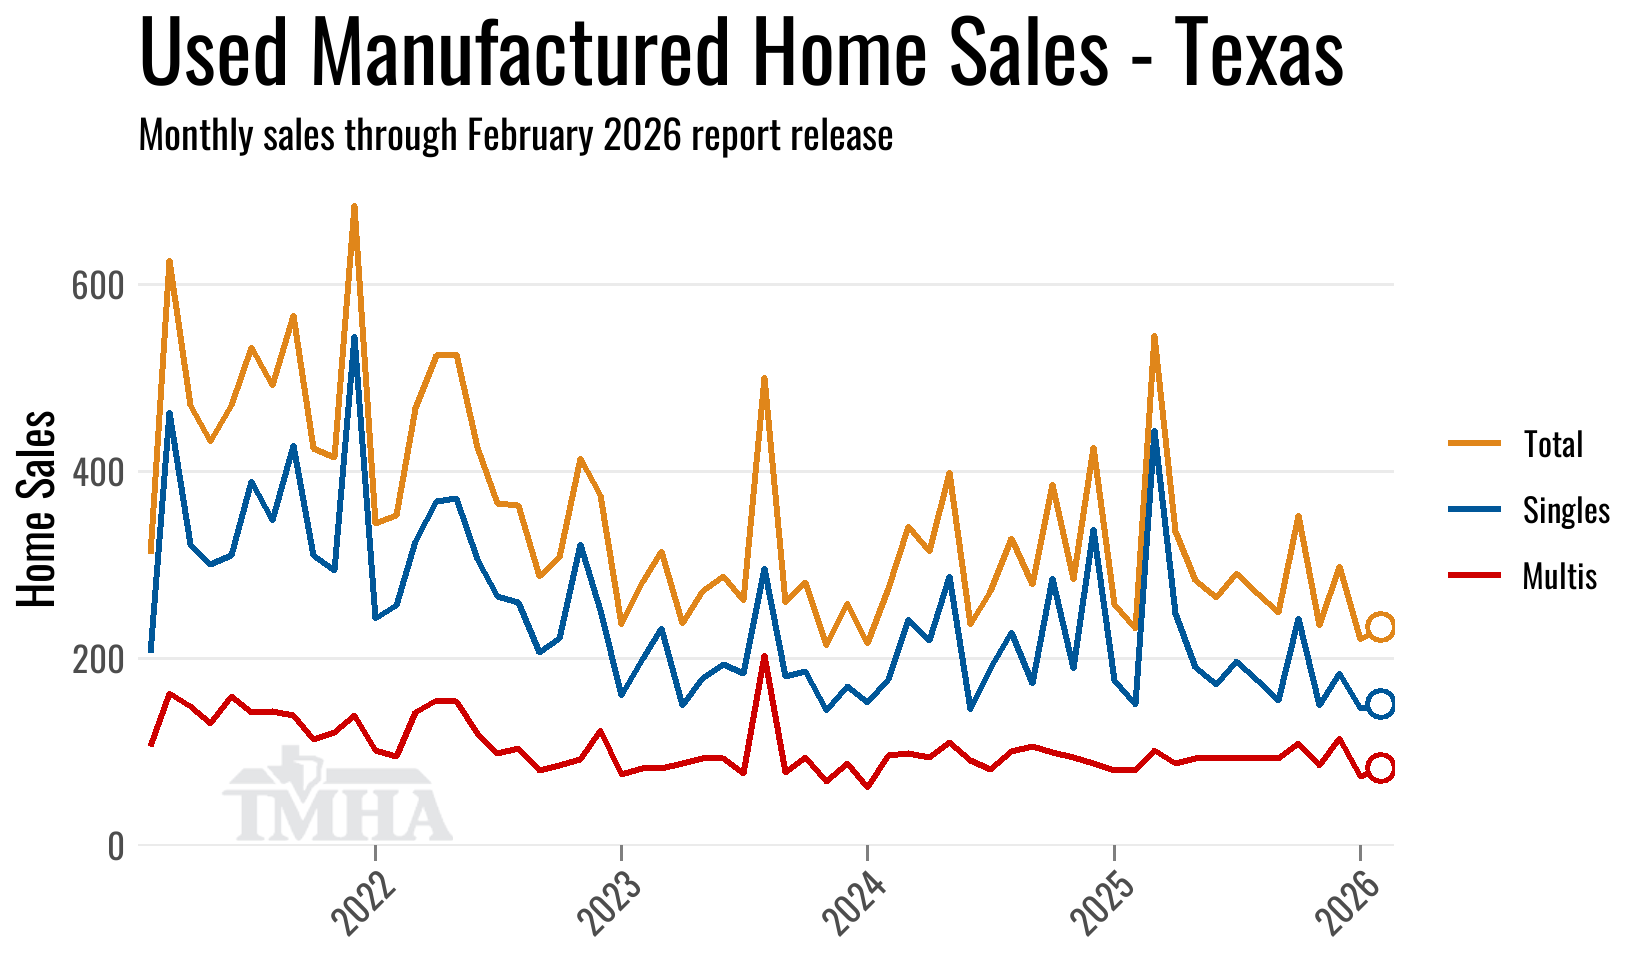
Used Homes
The used home retail sales data is noisy as it includes commercial purchases of park-owned homes after a manufactured home property is sold to a new buyer, but there was a clear downward trend in total transactions in the higher interest rate environment from 2022 through 2024 and have been roughly flat since.
| Used Sales | Singles | Multis | Total |
|---|---|---|---|
| Total for 2026 titled to date: | 487 | 290 | 777 |
| Change from 2025 (%): | 9.7% | 56.8% | 23.5% |
| Change from 2025 (Units): | 43 | 105 | 148 |
Revised Monthly Totals
Because titles continue to come in for past sales months, here are the prior 12 months and what their current sales totals are at this report release.
| New Sales Month | Singles | Multis | Total | (YoY%) |
|---|---|---|---|---|
| January 2026 | 374 | 553 | 927 | 7.9 |
| December 2025 | 517 | 744 | 1,261 | 13.6 |
| November 2025 | 412 | 705 | 1,117 | -9.5 |
| October 2025 | 504 | 813 | 1,317 | -3.7 |
| September 2025 | 514 | 756 | 1,270 | -1.8 |
| August 2025 | 530 | 935 | 1,465 | 0.1 |
| July 2025 | 541 | 775 | 1,316 | 2.1 |
| June 2025 | 502 | 636 | 1,138 | -14.9 |
| May 2025 | 589 | 785 | 1,374 | -3.2 |
| April 2025 | 608 | 862 | 1,470 | -6.5 |
| March 2025 | 630 | 920 | 1,550 | 2.9 |
| February 2025 | 487 | 690 | 1,177 | -4.0 |
| Used Sales Month | Singles | Multis | Total | (YoY%) |
|---|---|---|---|---|
| January 2026 | 137 | 67 | 204 | 2.0 |
| December 2025 | 184 | 115 | 299 | -20.1 |
| November 2025 | 150 | 86 | 236 | 0.9 |
| October 2025 | 243 | 110 | 353 | -1.1 |
| September 2025 | 156 | 94 | 250 | -4.2 |
| August 2025 | 177 | 93 | 270 | -11.2 |
| July 2025 | 197 | 94 | 291 | 15.0 |
| June 2025 | 173 | 93 | 266 | 20.9 |
| May 2025 | 191 | 93 | 284 | -13.4 |
| April 2025 | 248 | 88 | 336 | 15.5 |
| March 2025 | 444 | 102 | 546 | 69.0 |
| February 2025 | 151 | 81 | 232 | -12.8 |