Texas Manufactured Home Shipments Report April 2026 - Market Analysis & Data
Rob Ripperda
May Shipments
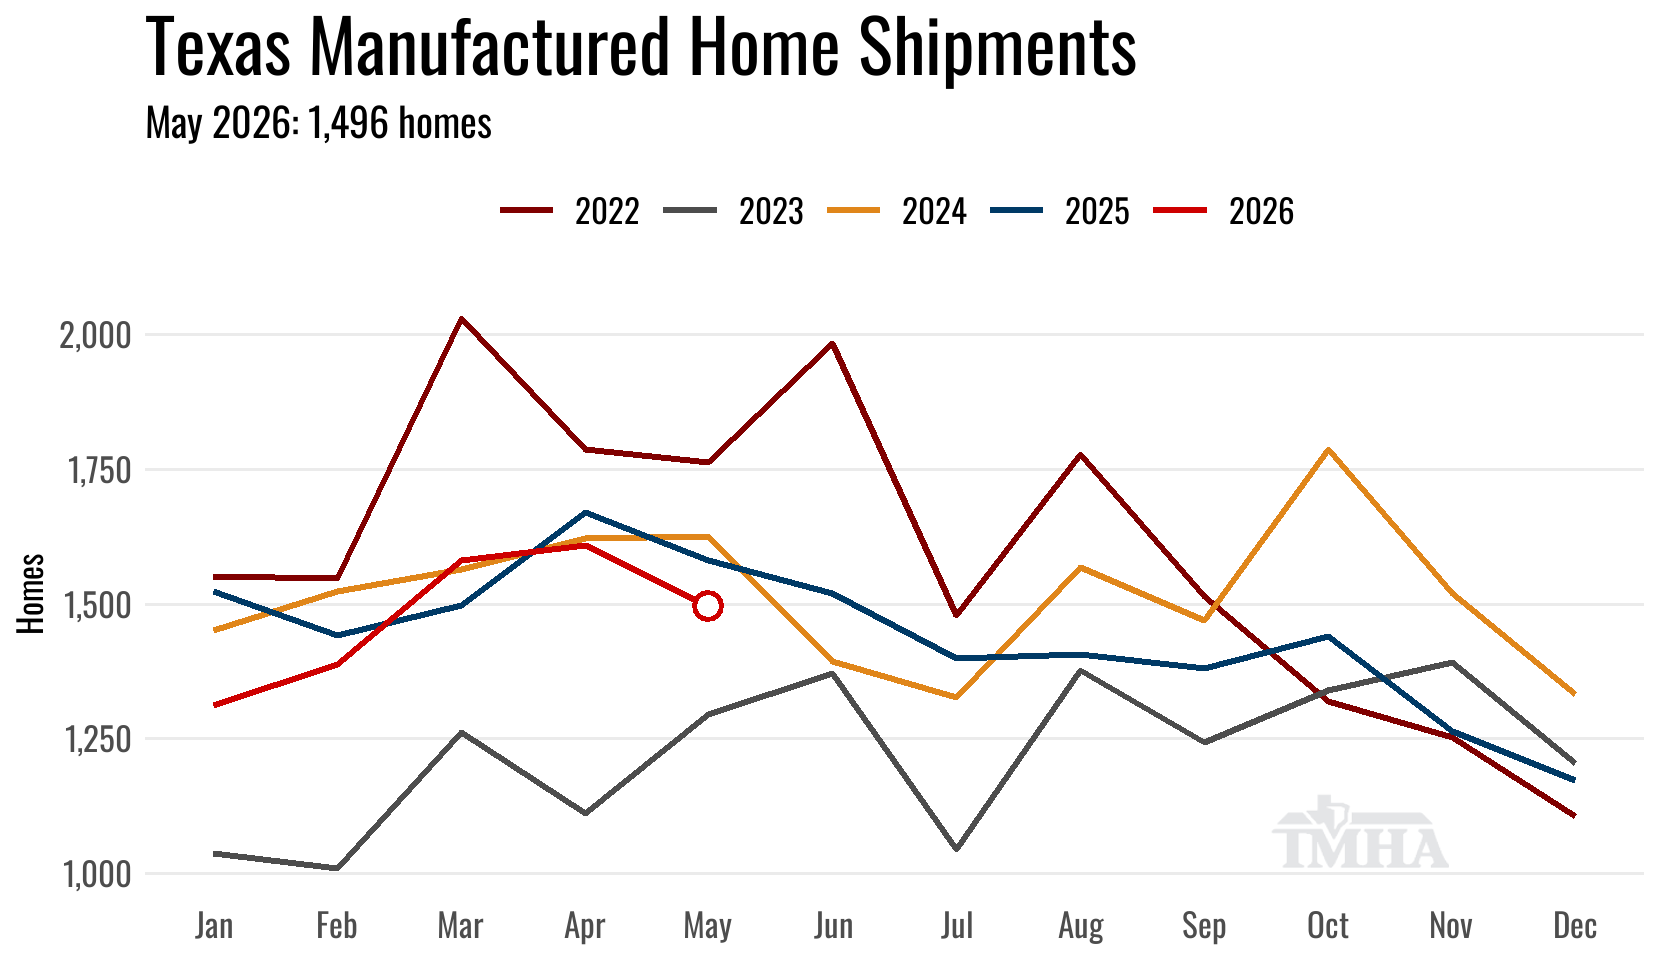
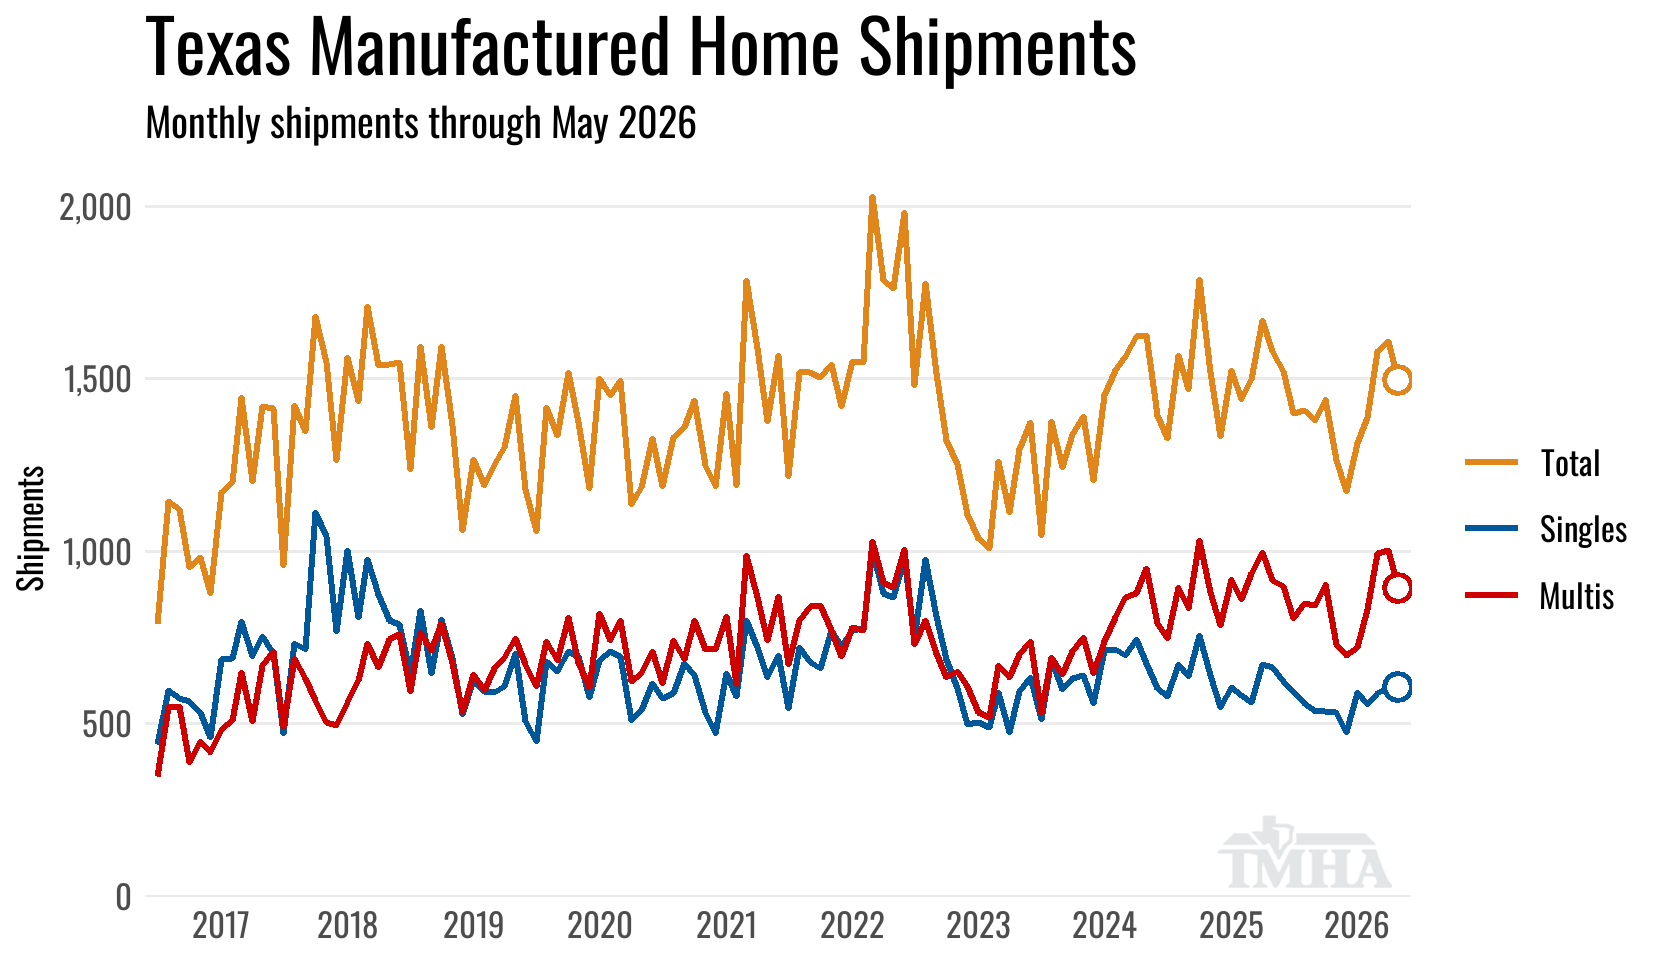
Manufactured home shipments to Texas retailers moved up 2% in May on a seasonally-adjusted basis from the prior month. Year over year, shipments were 5.3% below May of 2025, but an extra day of production is stretching what was probably less than a one percent decline when looking at the rate of homes shipped per business day.
The 1,496 total homes shipped for the month landed in the upper half of the prediction interval at 10 homes above the point forecast from last month.
| Shipments | Singles | Multis | Total |
|---|---|---|---|
| Total for May: | 605 | 891 | 1,496 |
| Change from April (Raw %): | 0% | -11.2% | -7% |
| Change from April (Raw Units): | 0 | -112 | -112 |
| Change from April (SA %): | 7.8% | -3.4% | 2% |
| Change from May of 2025 (%): | -8.9% | -2.7% | -5.3% |
| Change from May of 2025 (Units): | -59 | -25 | -84 |
Monthly Manufacturer Shipments
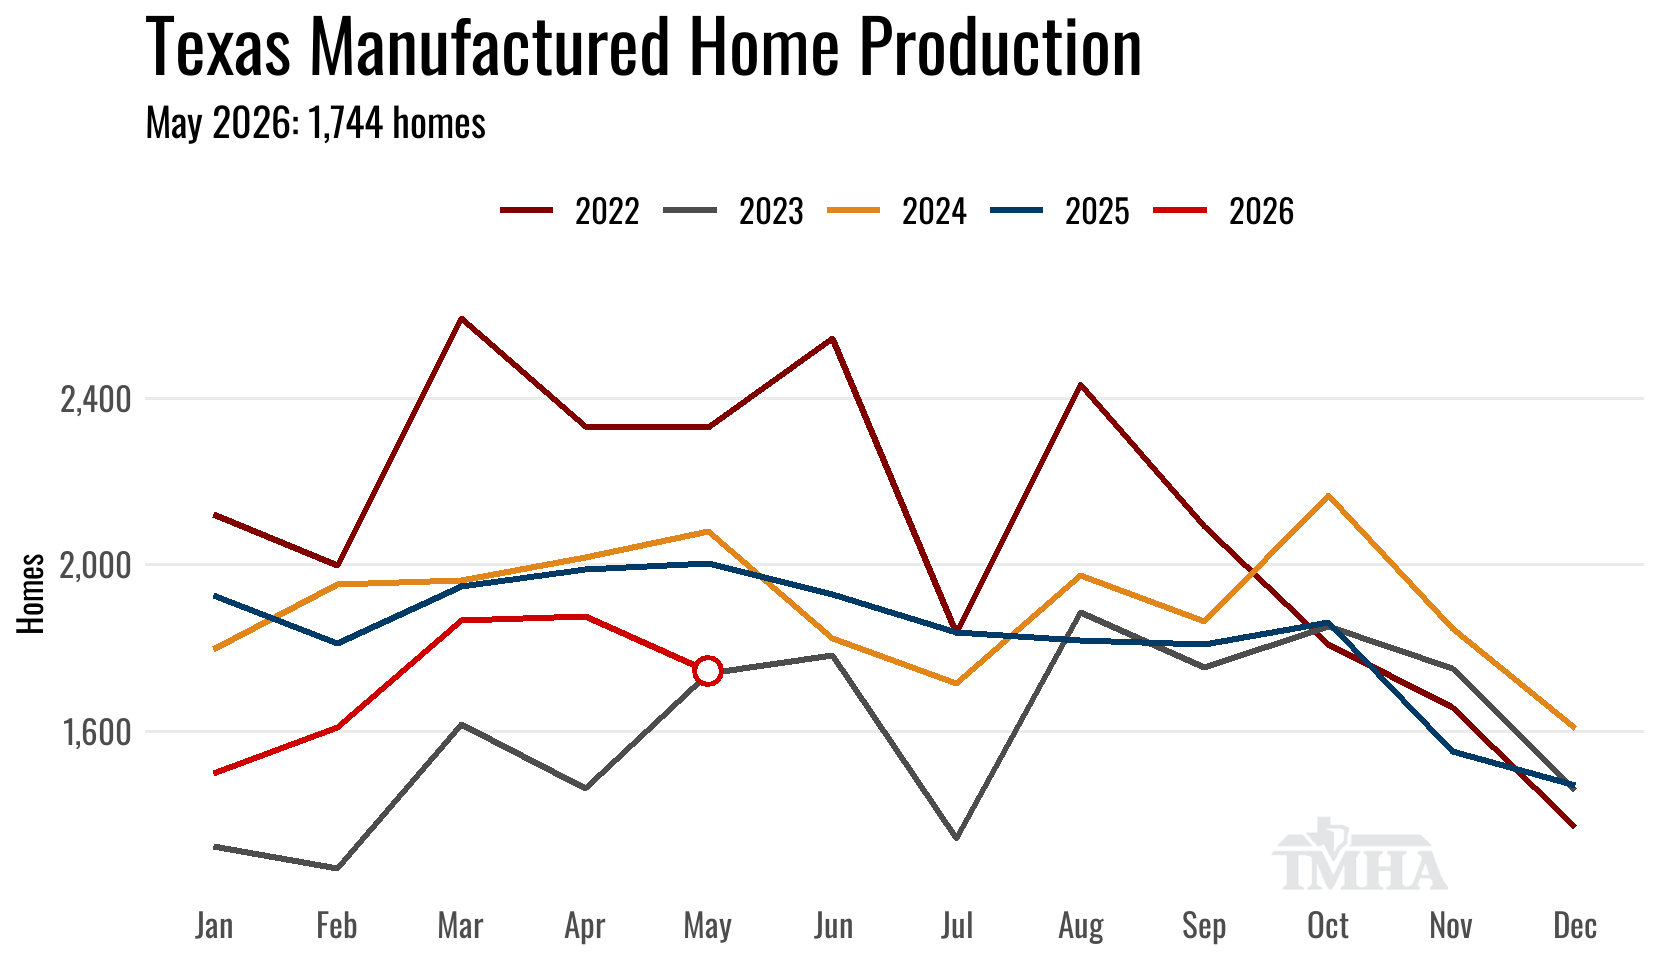
May Production
Texas manufactured housing plant production moved down in May 0.4% on a seasonally-adjusted basis from the previous month. The total of homes produced was 1,744 and the minimum number of floors was 2,540.
Year over year, total homes were 12.9% below May of 2025, and minimum floors were 10.5% below the previous year. Like shipments, the additional calendar day is accentuating the decline in production but after accounting for that difference by looking directly at run rates, total home production was still down 8.5% under last May and the min floor rate was down 6% respectively.
The production total landed in the upper side of the prediction interval, 26 homes above last month’s point forecast.
On a run-rate basis Texas production has improved every month this year, with May’s dip in the seasonally-adjusted total reflecting a light 20-day production calendar. Even so, weakness in out of state deliveries has kept production trailing 2025 levels. Homes shipped out of state fell nearly 30% from a year ago and kept May’s total well below last year.
| Texas Plant Production | Total | Shipped Out of TX | Min Floors |
|---|---|---|---|
| Total for May: | 1,744 | 376 | 2,540 |
| Change from April (Raw %): | -7% | -5.3% | -8.7% |
| Change from April (Raw Units): | -132 | -21 | -243 |
| Change from April (SA %): | -0.4% | NA | -2.4% |
| Change from May of 2025 (%): | -12.9% | -29.2% | -10.5% |
| Change from May of 2025 (Units): | -258 | -155 | -298 |
Monthly Manufacturer Shipments
June Outlook
The forecasting models point to June shipments around 1,574 (1,364–1,783) and Texas factory production around 1,890 (1,667–2,114).
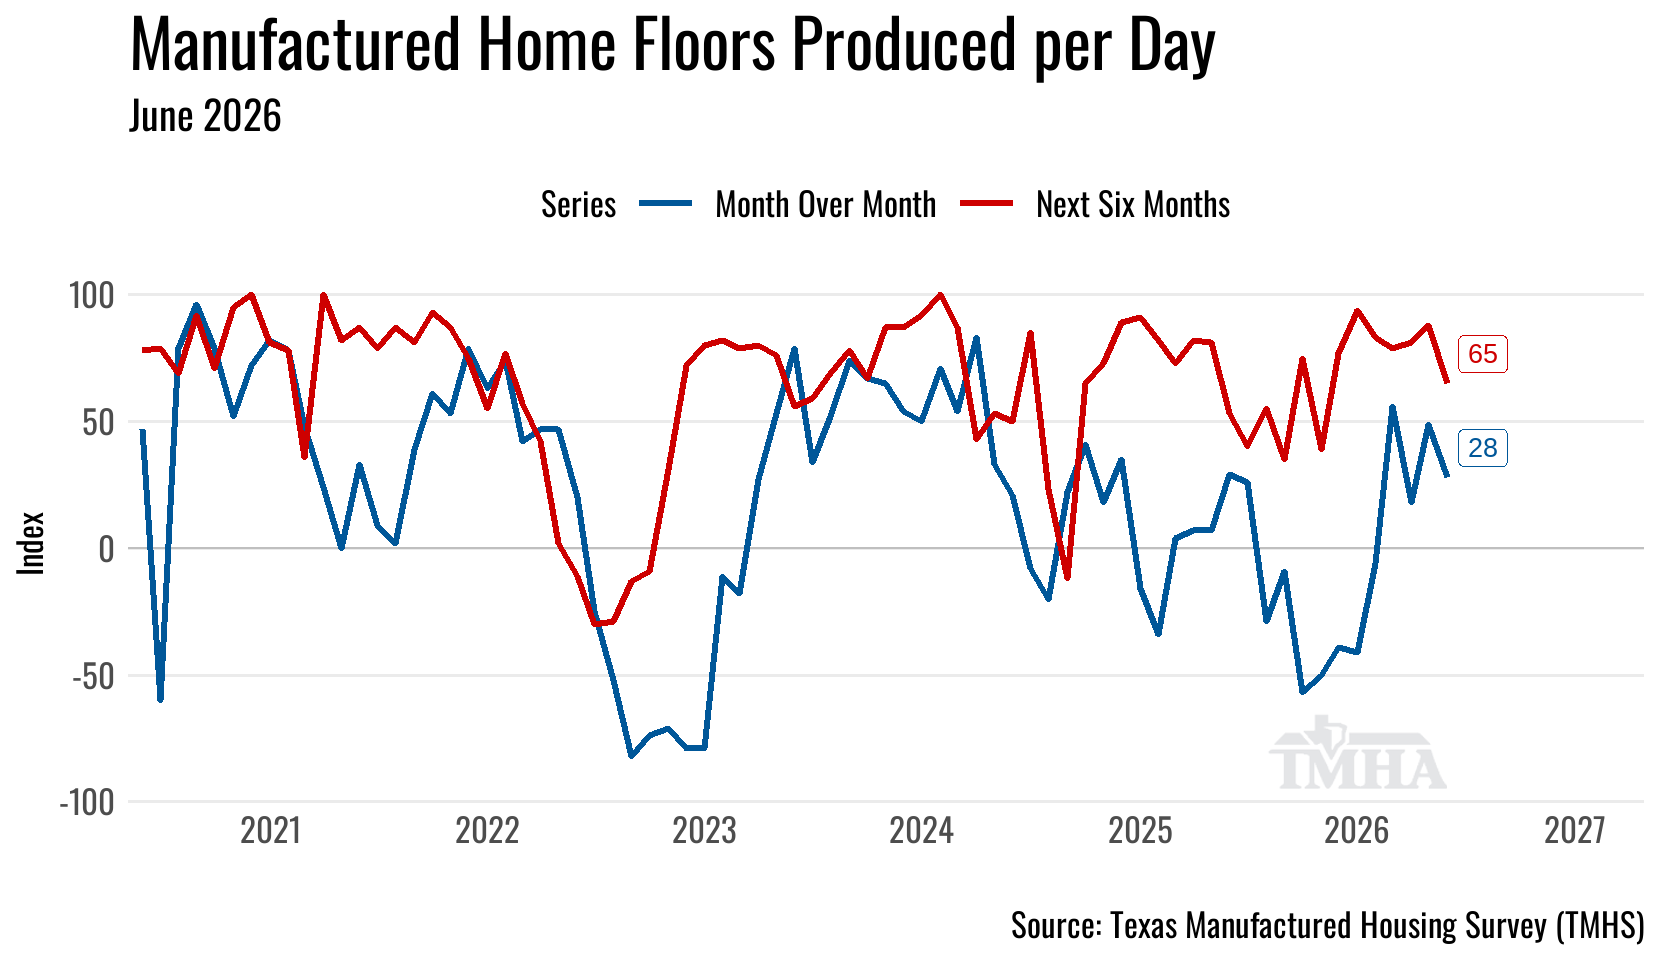
The Texas Manufactured Housing Survey (TMHS) signaled a continued increase in run rates for June.
June gains two production days over May and the TMHS points toward further expansion in run rates, take the overs.
Texas Manufactured Home Survey Results
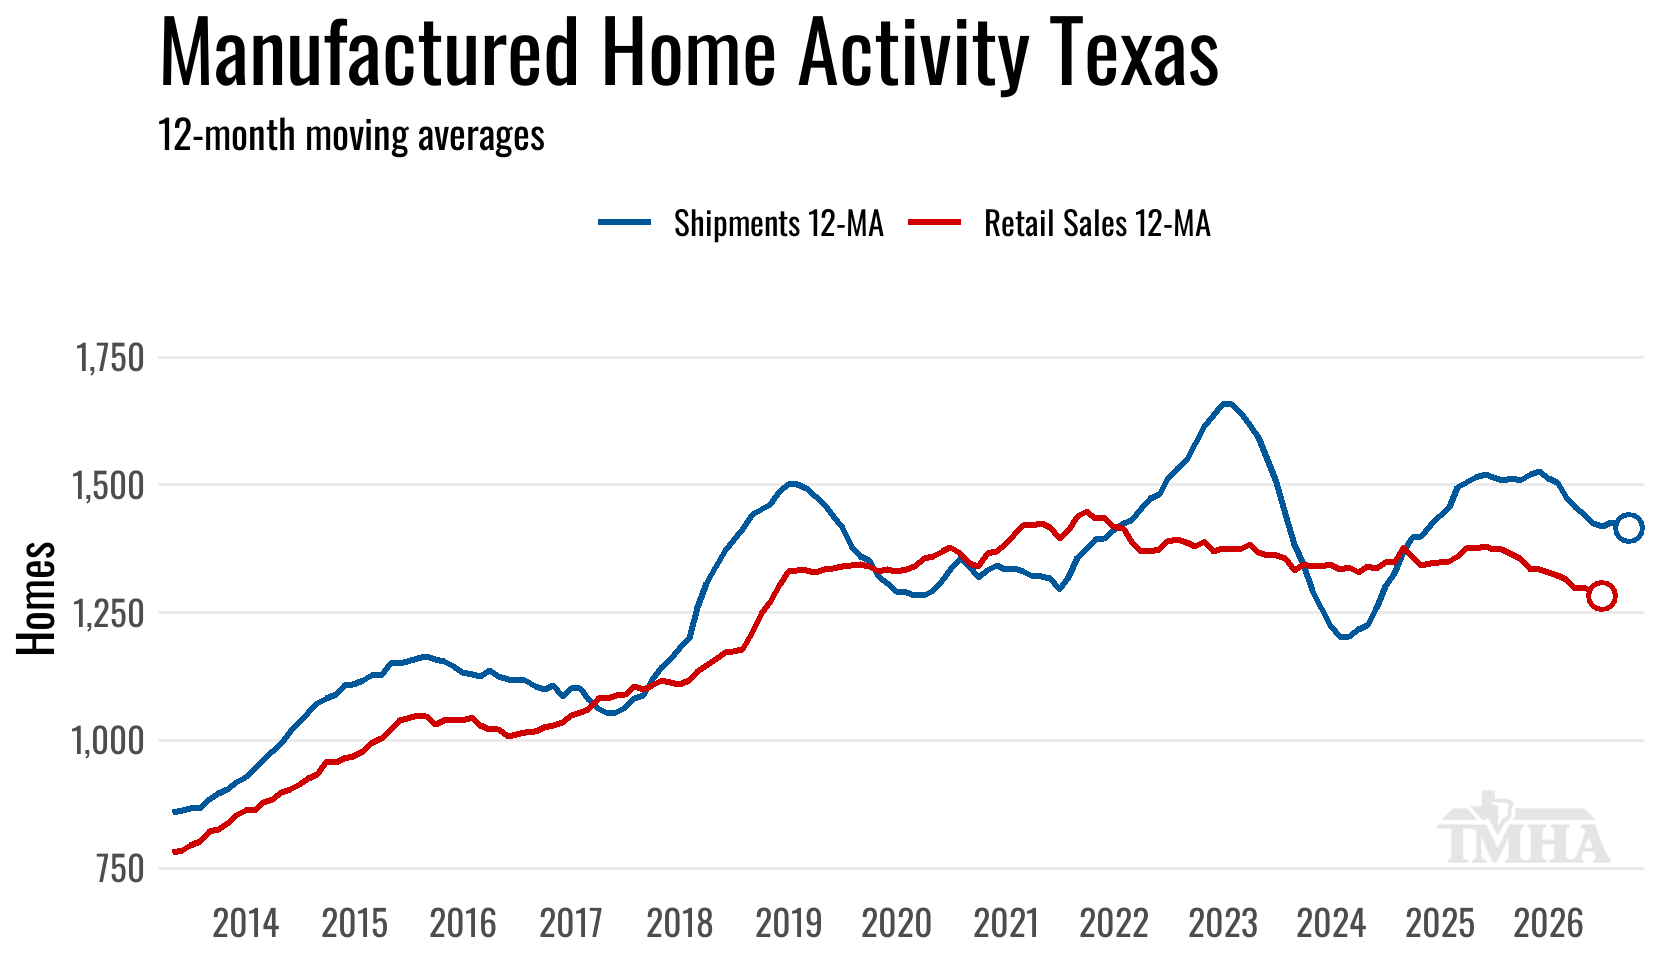
Retail Sales Comparison
The 12-month moving average for shipments peaked in July of 2025 for this last production expansion cycle and has been moving lower since with the exception of one upturn in March 2026.
The 12-month moving average for retail sales is currently plotted through February 2026. Late title work will continue to push the most recent months higher, though not to the extent seen in prior years.
Year to Date
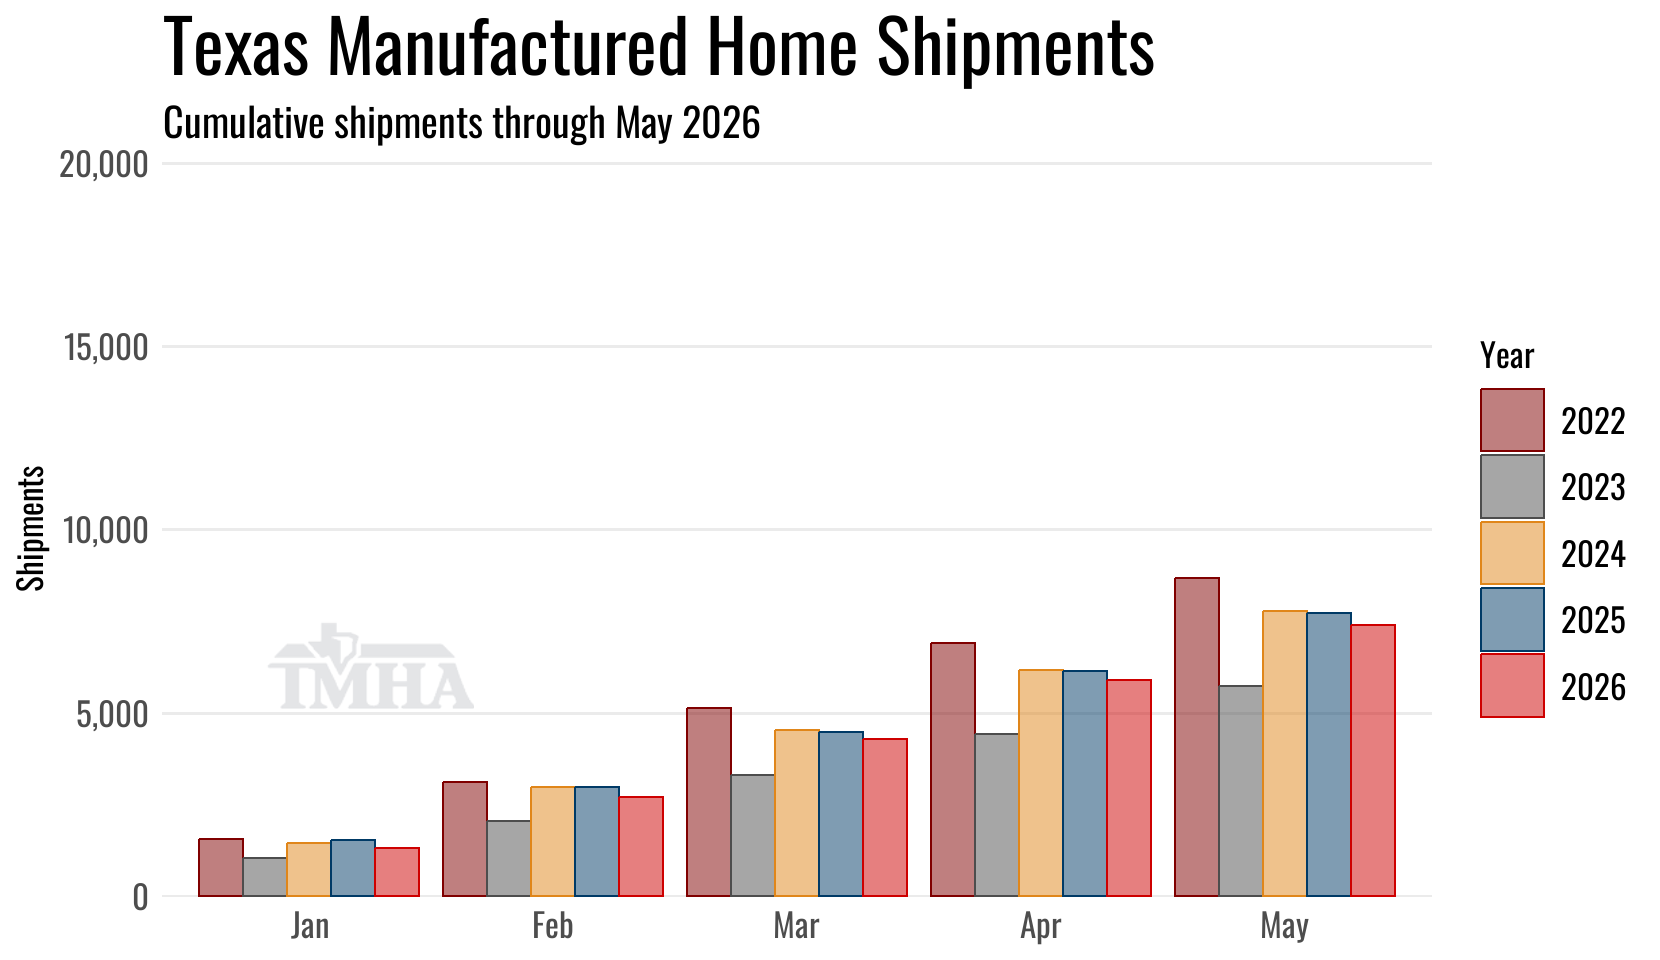
Shipments
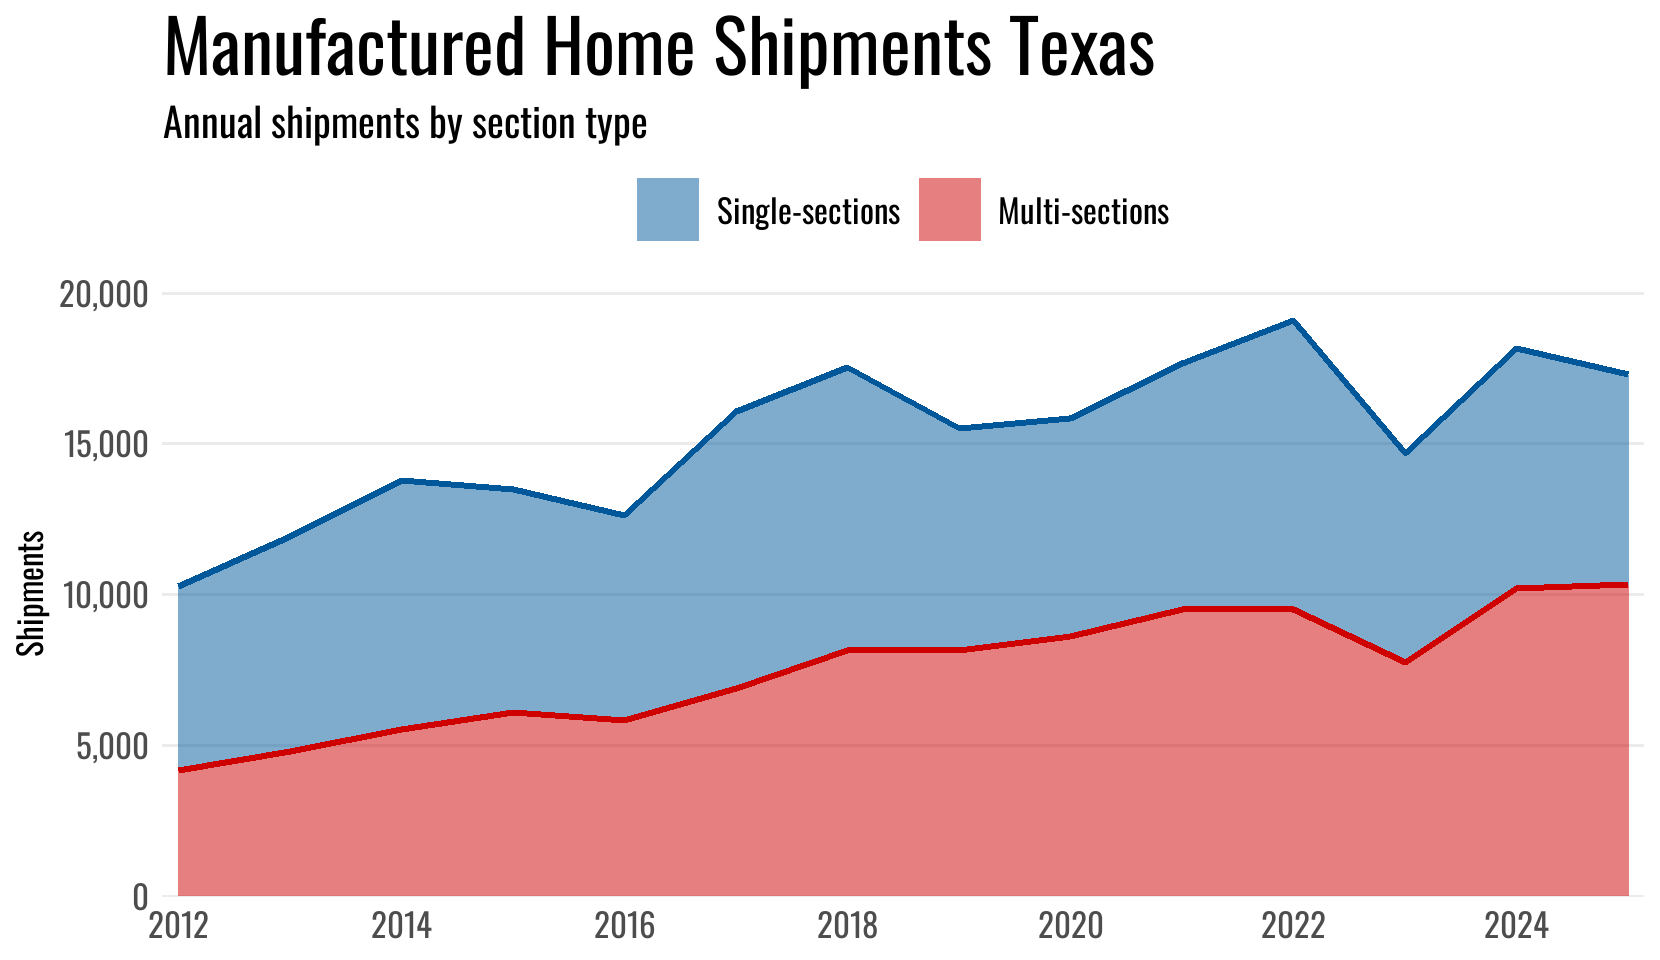
Shipments for the year are currently 4.3% below 2025. Both single-section and multi-section homes are down.
The forecast for 2026 Texas shipments moved up to 17,449 (15,623–19,379).
| Shipments | Singles | Multis | Total |
|---|---|---|---|
| Total for 2026 YTD: | 2,944 | 4,440 | 7,384 |
| Change from 2025 (%): | -4.7% | -4% | -4.3% |
| Change from 2025 (Units): | -144 | -184 | -328 |
Production
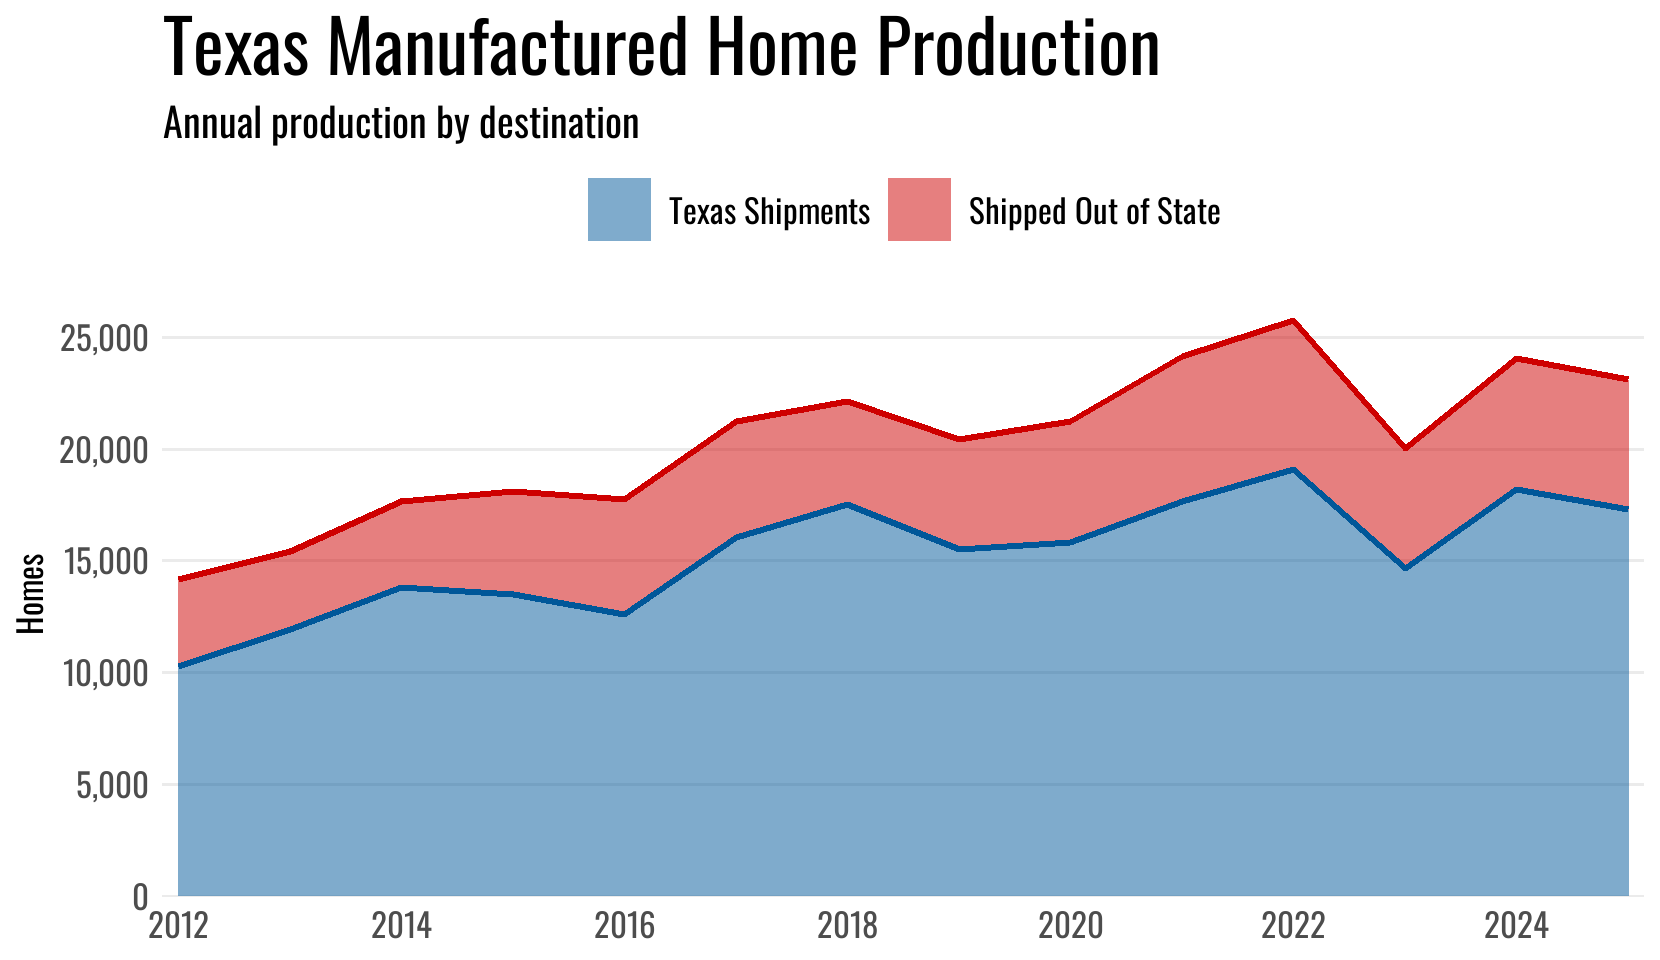
Texas plant total home production for 2026 is 11.2% below the previous year and the minimum floors built are 9.4% below 2025. Homes shipped out of state are down 25.4% so far this year.
The forecast for 2026 Texas plant production moved up to 20,397 (18,572–22,390).
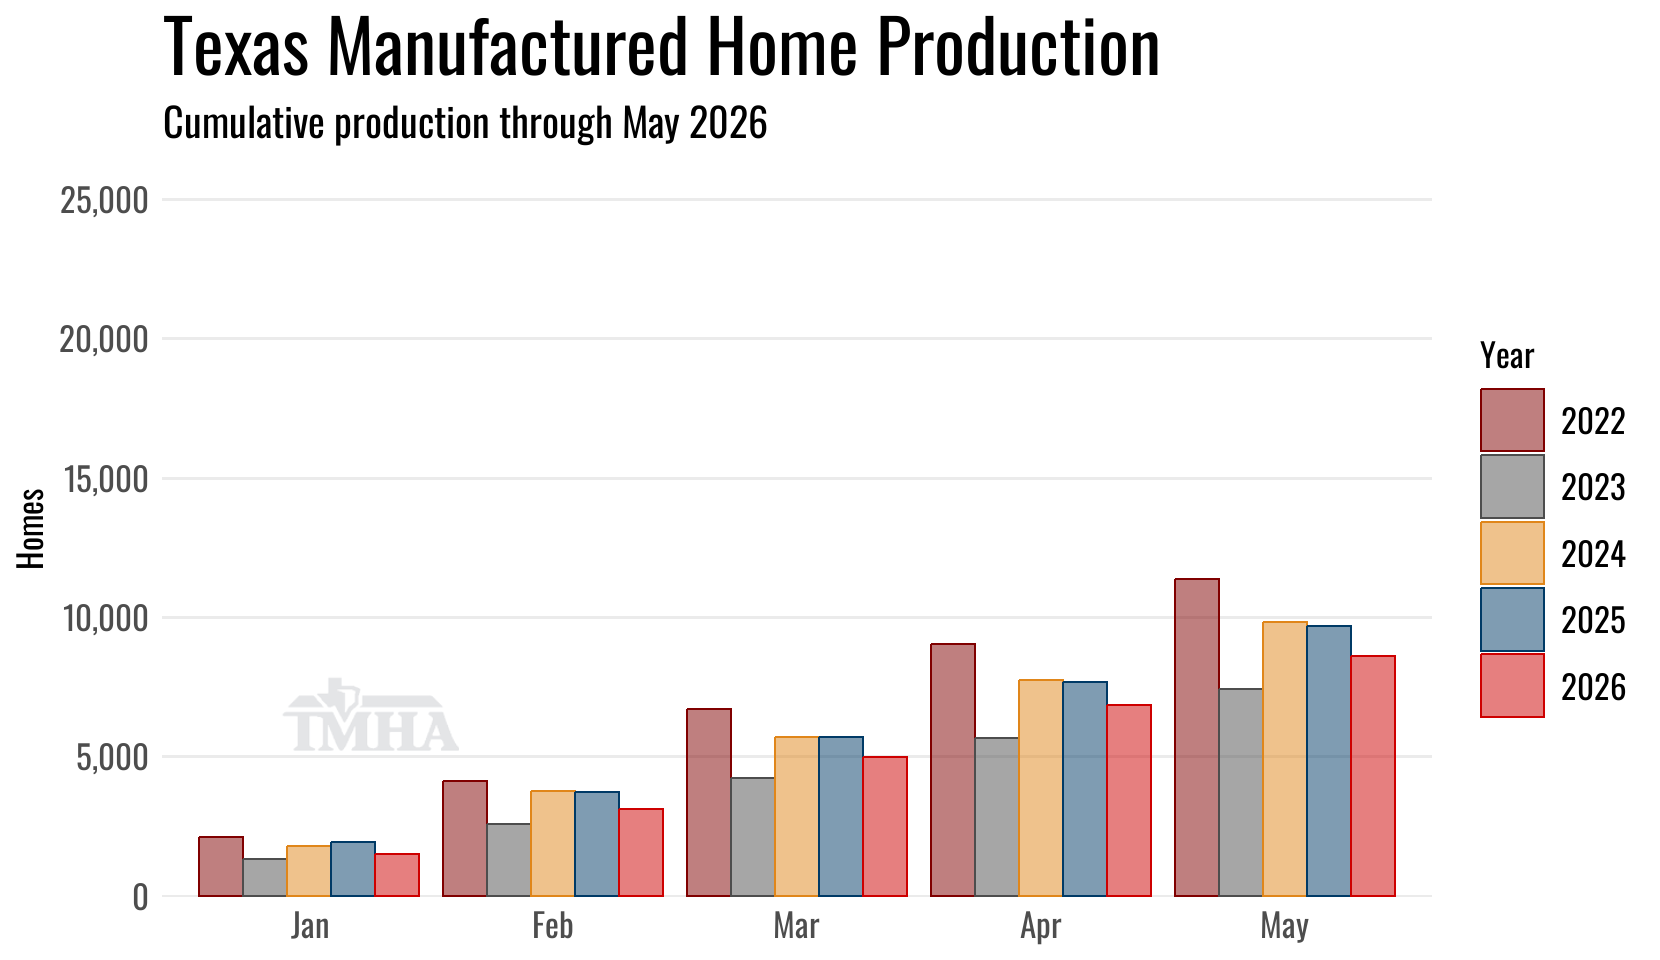
| Texas Plant Production | Total | Shipped Out of TX | Min Floors |
|---|---|---|---|
| Total for 2026 YTD: | 8,593 | 1,879 | 12,594 |
| Change from 2025 (%): | -11.2% | -25.4% | -9.4% |
| Change from 2025 (Units): | -1,085 | -641 | -1,309 |
Annual Totals