Texas Manufactured Housing Market Report November 2025 - Sales Data & Analysis
Rob Ripperda
November
Early Look
New manufactured home sales in November titled to date are down a seasonally-adjusted 3% from the previous month and the titling shift that has been underway since August continues to inflate the year-over-year numbers as homes that would have previously been titled with an earlier purchase contract date are now titled later when the transfer of ownership ultimately ocurrs.
In the plot below you can see that most months in 2025 from August on continue to lead the previous four years with September being the one exception.
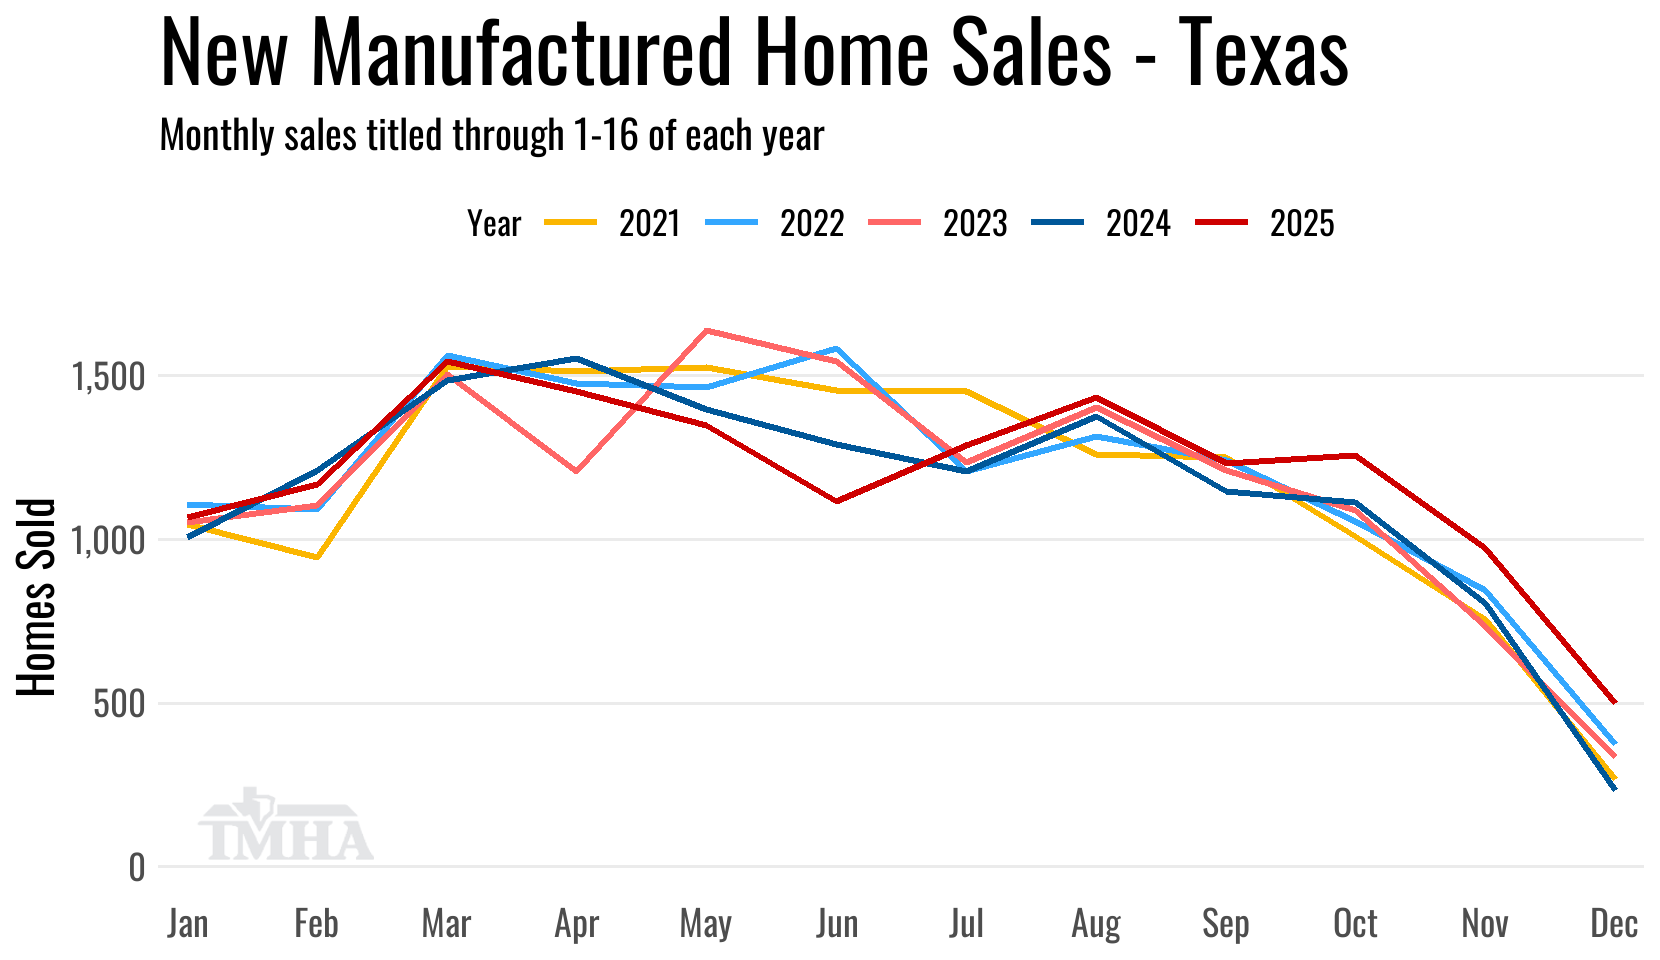
The comparisons in the table below are based on where the previous month’s numbers were when originally reported on one month ago.
| New Sales | Singles | Multis | Total |
|---|---|---|---|
| Total for November: | 354 | 611 | 965 |
| Change from October (Raw %): | -23% | -16.6% | -19.1% |
| Change from October (Raw Units): | -106 | -122 | -228 |
| Change from October (SA %): | -6% | -4.8% | -3% |
| Change from November of 2024 (%): | -6.1% | 46.5% | 21.5% |
| Change from November of 2024 (Units): | -23 | 194 | 171 |
THMA Member’s Retailer Annual Sales Totals Report
October
Titled on Time
New home sales for October titled to date remained up a seasonally adjusted 3.3% from the previous month and are up 13.2% on the raw total from October of 2024.
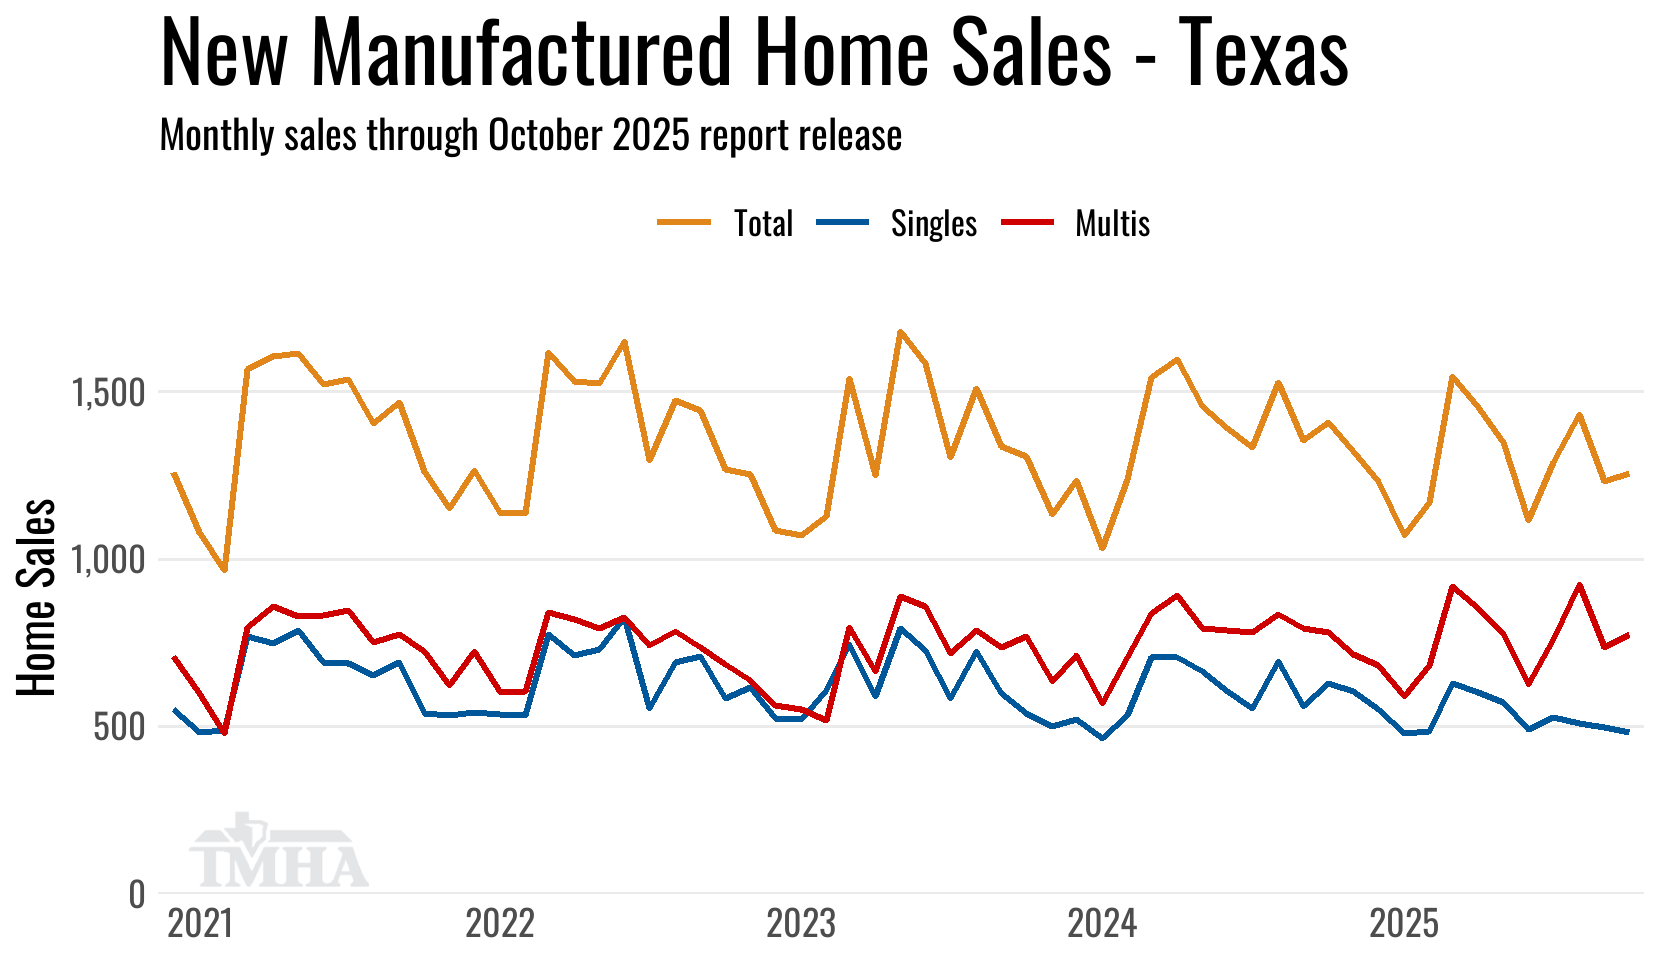
While the plot above contains revised totals for previous months the comparisons in the table below are based on where the previous month’s numbers were when released one month ago.
| New Sales | Singles | Multis | Total |
|---|---|---|---|
| Total for October: | 483 | 773 | 1,256 |
| Change from September (Raw %): | -2% | 6.5% | 3% |
| Change from September (Raw Units): | -10 | 47 | 37 |
| Change from September (SA %): | -0.4% | 5.6% | 3.3% |
| Change from October of 2024 (%): | -4.9% | 28.4% | 13.2% |
| Change from October of 2024 (Units): | -25 | 171 | 146 |
THMA Member’s Retailer Monthly Sales Totals Report
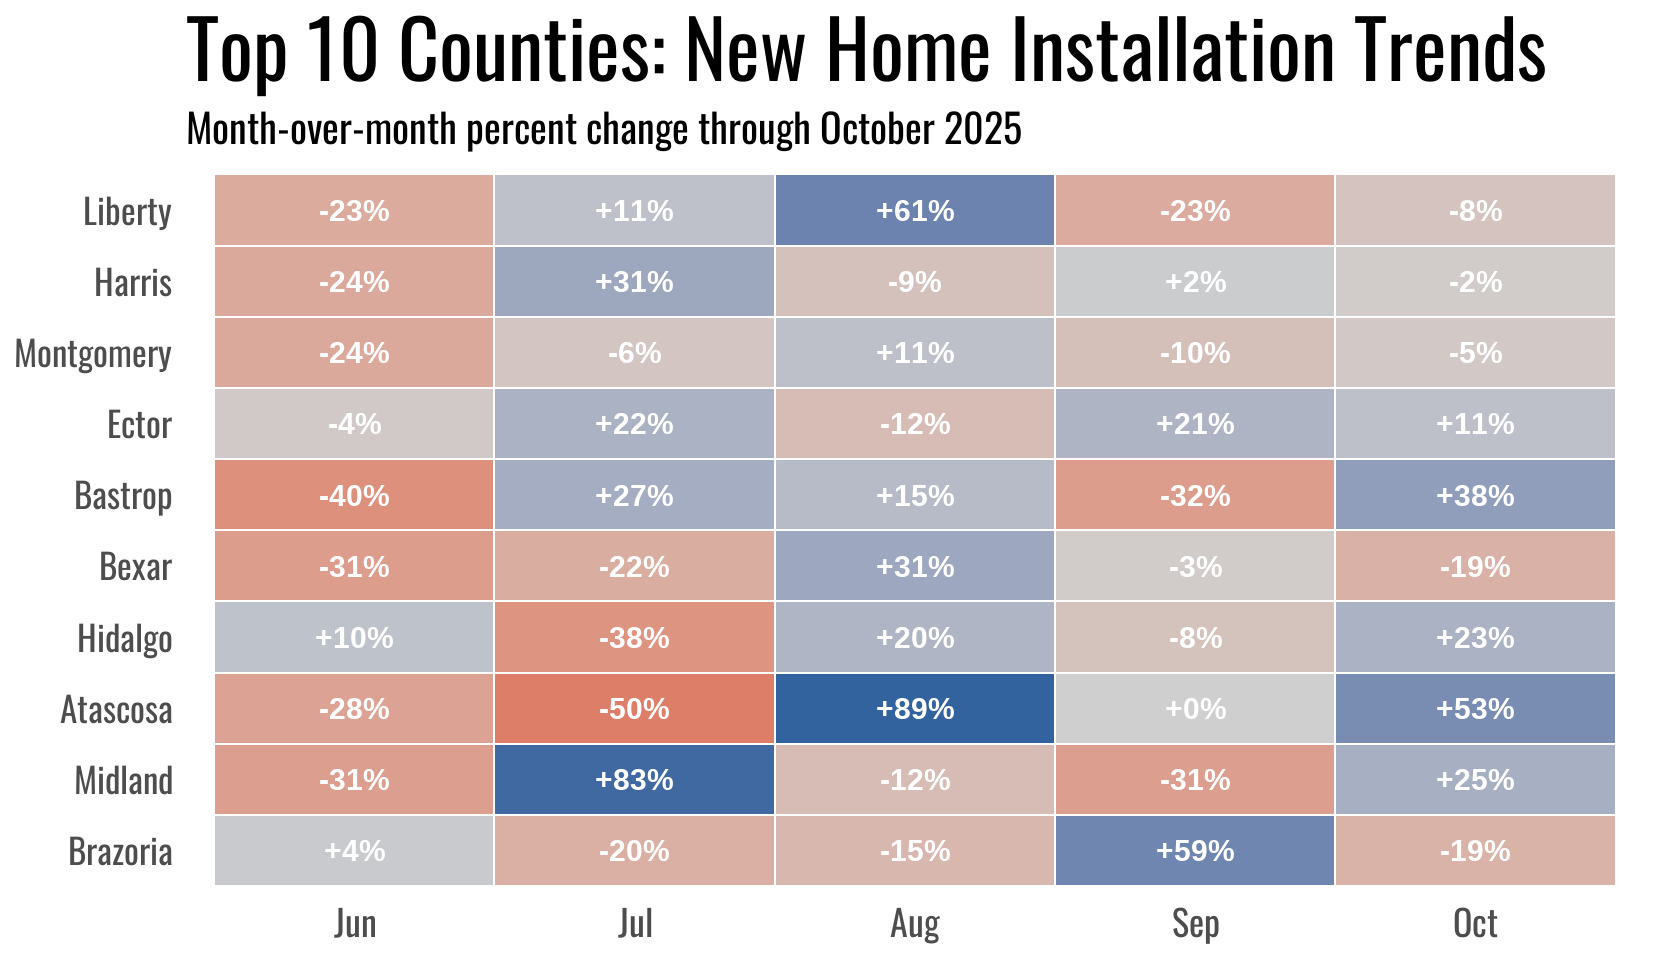
Here are the month-over-month changes for the top ten counties for new home sales in October and in the previous four months.
THMA Member’s Retailer Annual Sales Total per County Report
Annual Totals
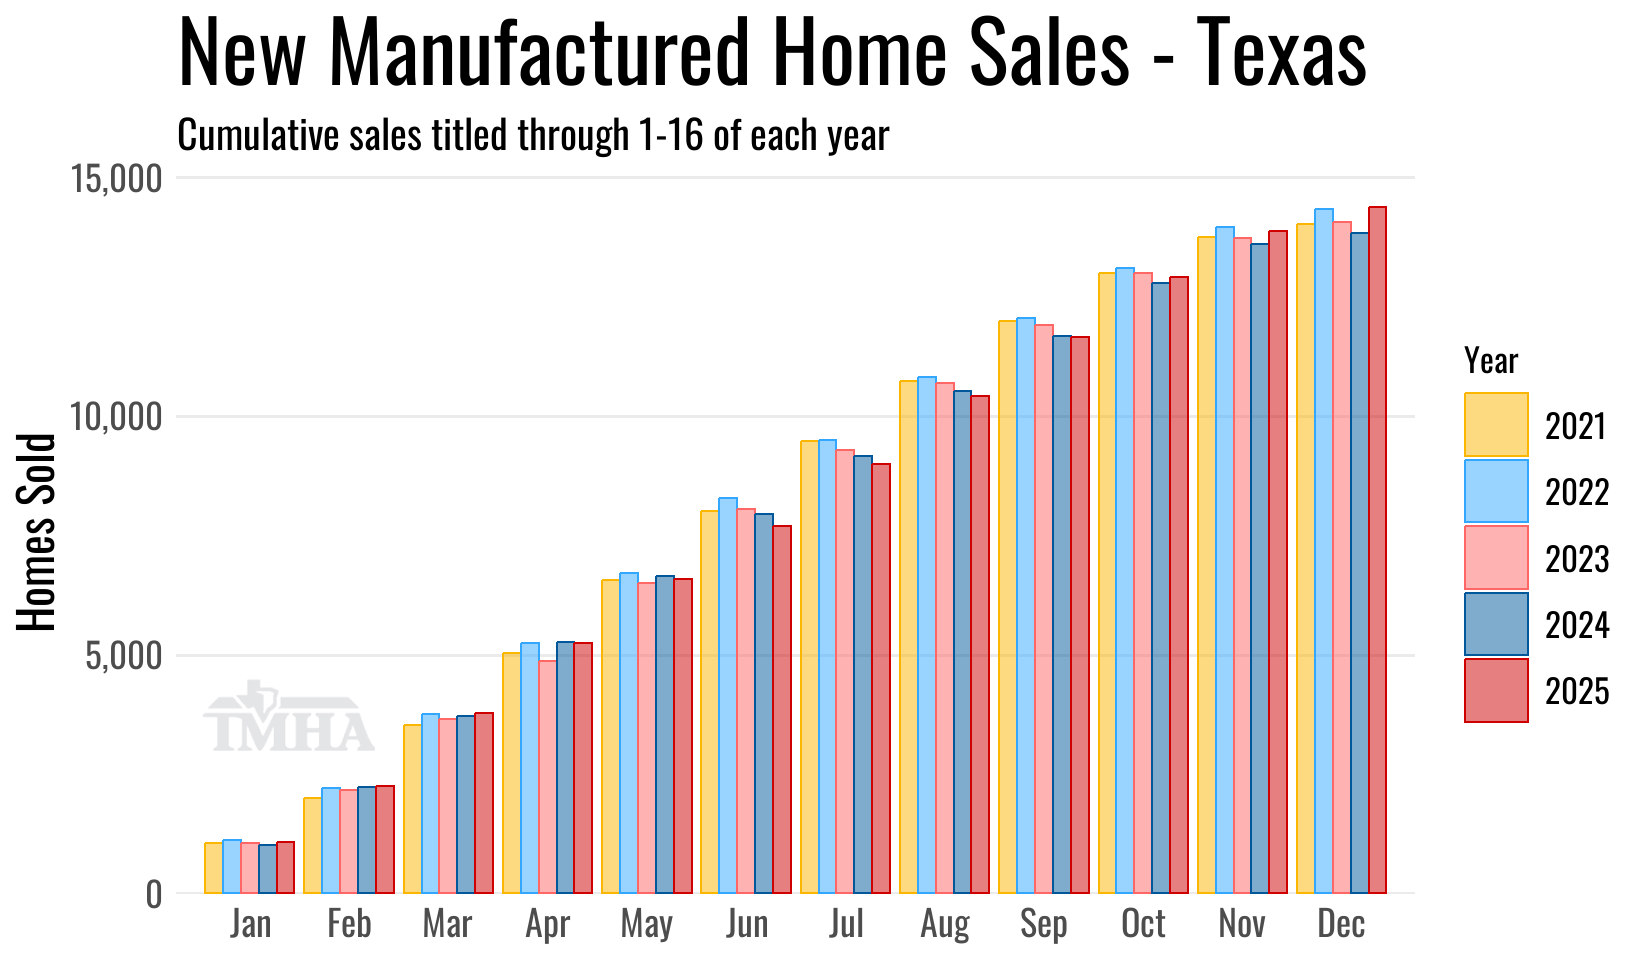
New home sales for 2025 are now up 4% for all retail sales titled through this point in the calendar. Multi-section sales are currently up 10.3% while single-section sales are down 4.1%.
The increased speed in title work submission is likely pushing year-over-year sales up some, but the effects should not be as strong as seen in the individual month figures as sales that otherwise would have been dated earlier in the year when agreements were signed are now coming in with a later sales date of when the transfer of ownership actually occurred.
| New Sales | Singles | Multis | Total |
|---|---|---|---|
| Total for 2025 titled to date: | 5,817 | 8,559 | 14,376 |
| Change from 2024 (%): | -4.1% | 10.3% | 4% |
| Change from 2024 (Units): | -249 | 796 | 547 |
THMA Member’s Retailer Annual Sales Totals Report
New Home Characterstics
The shift in title cadence has really pulled down the median age of multi-section homes to the shortest amount of days in our records, but that same dynamic should apply to single-section homes too yet their median age remains near the 2023 peak.
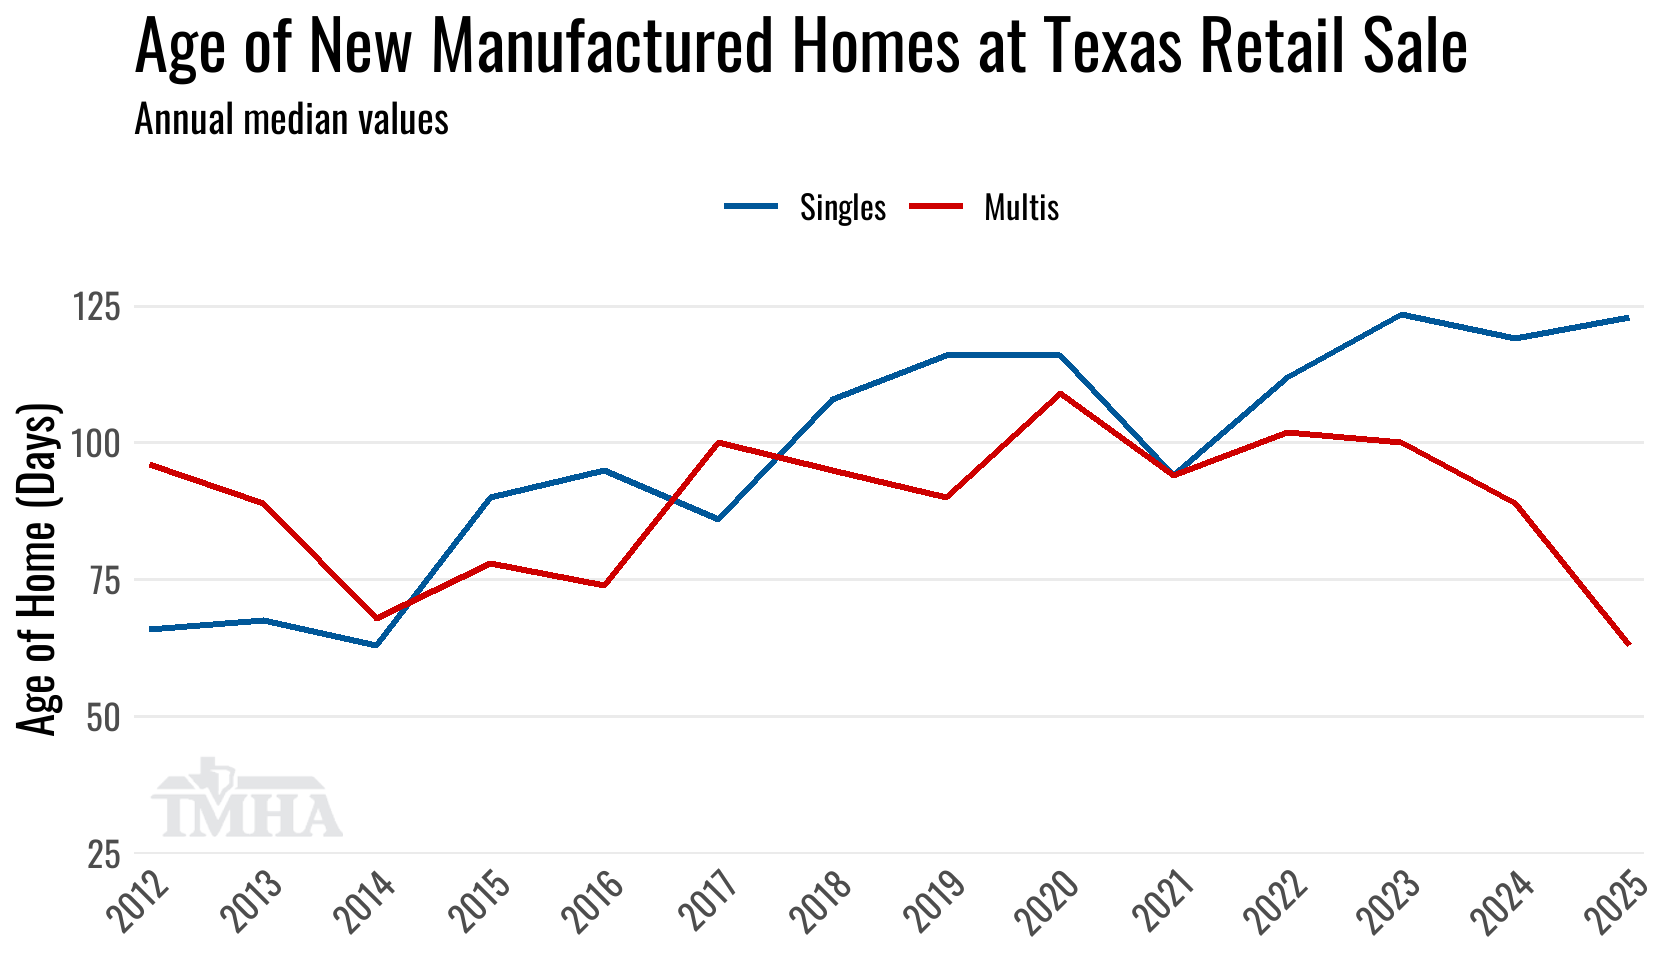
| New Home Characteristics for 2025 | Singles | Multis | Total |
|---|---|---|---|
| Median Age of Home (Days): | 123 | 63 | 86 |
| Median Square Footage: | 1,080 | 1,680 | 1,475 |
New Home Placement Locations
Here are the breakdowns in year-over-year changes for the top 10 counties in new home placements across home section types.
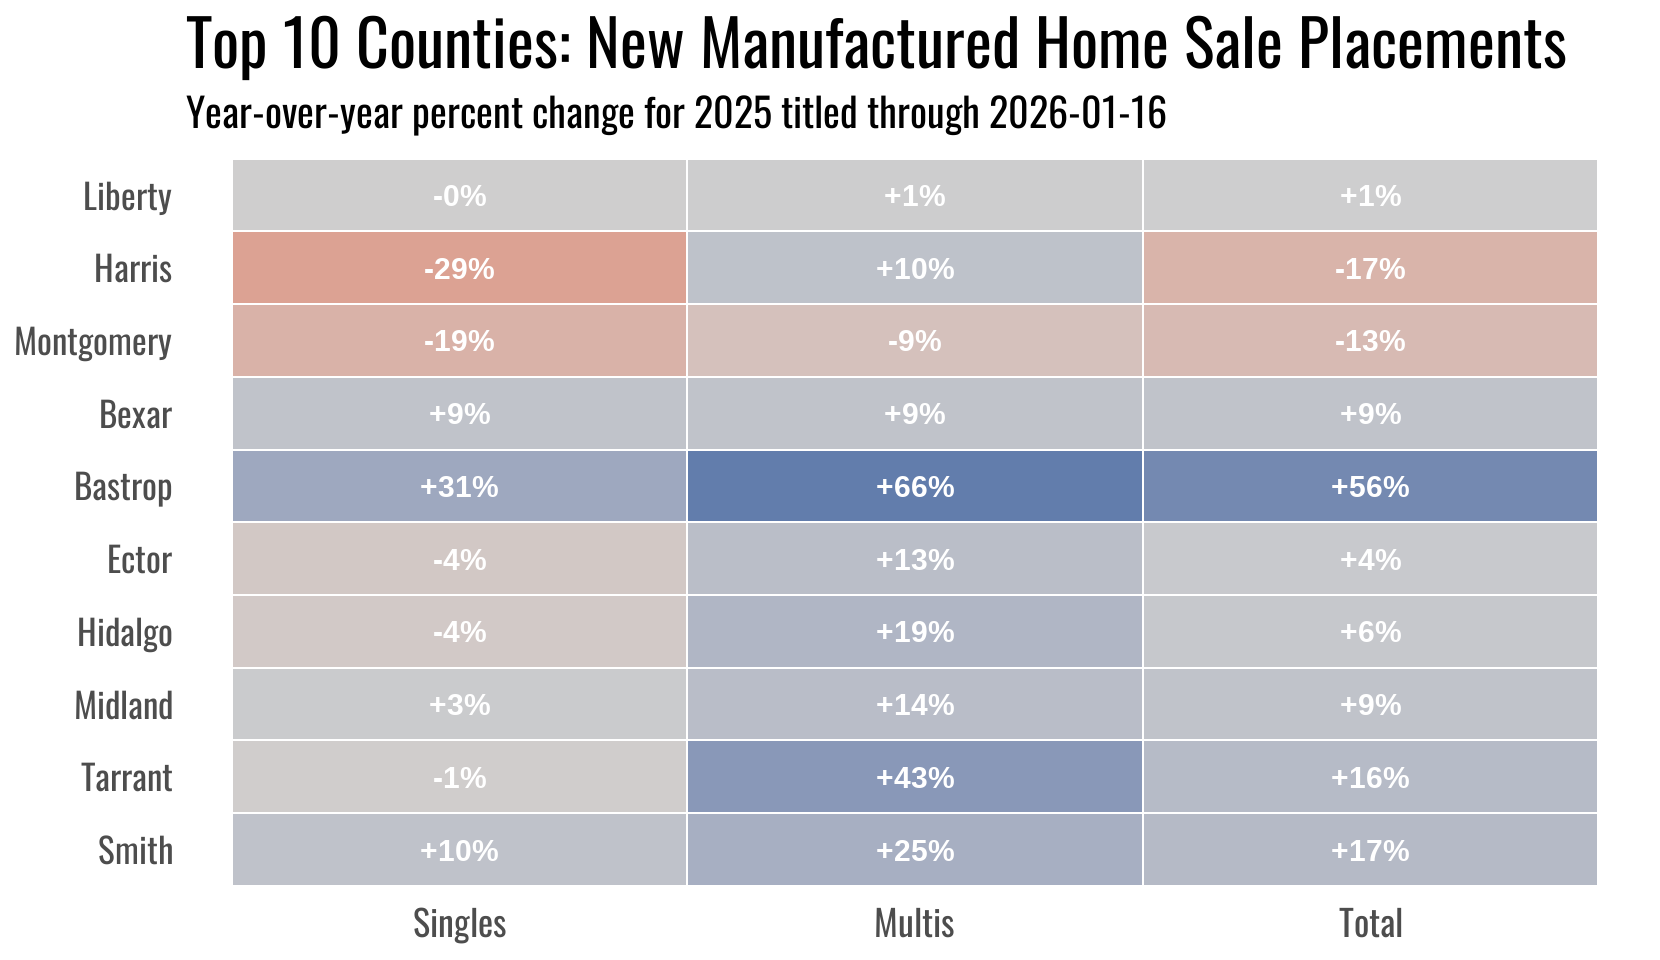
THMA Member’s Total Annual Retail Sales per County Report
Shipment Comparison
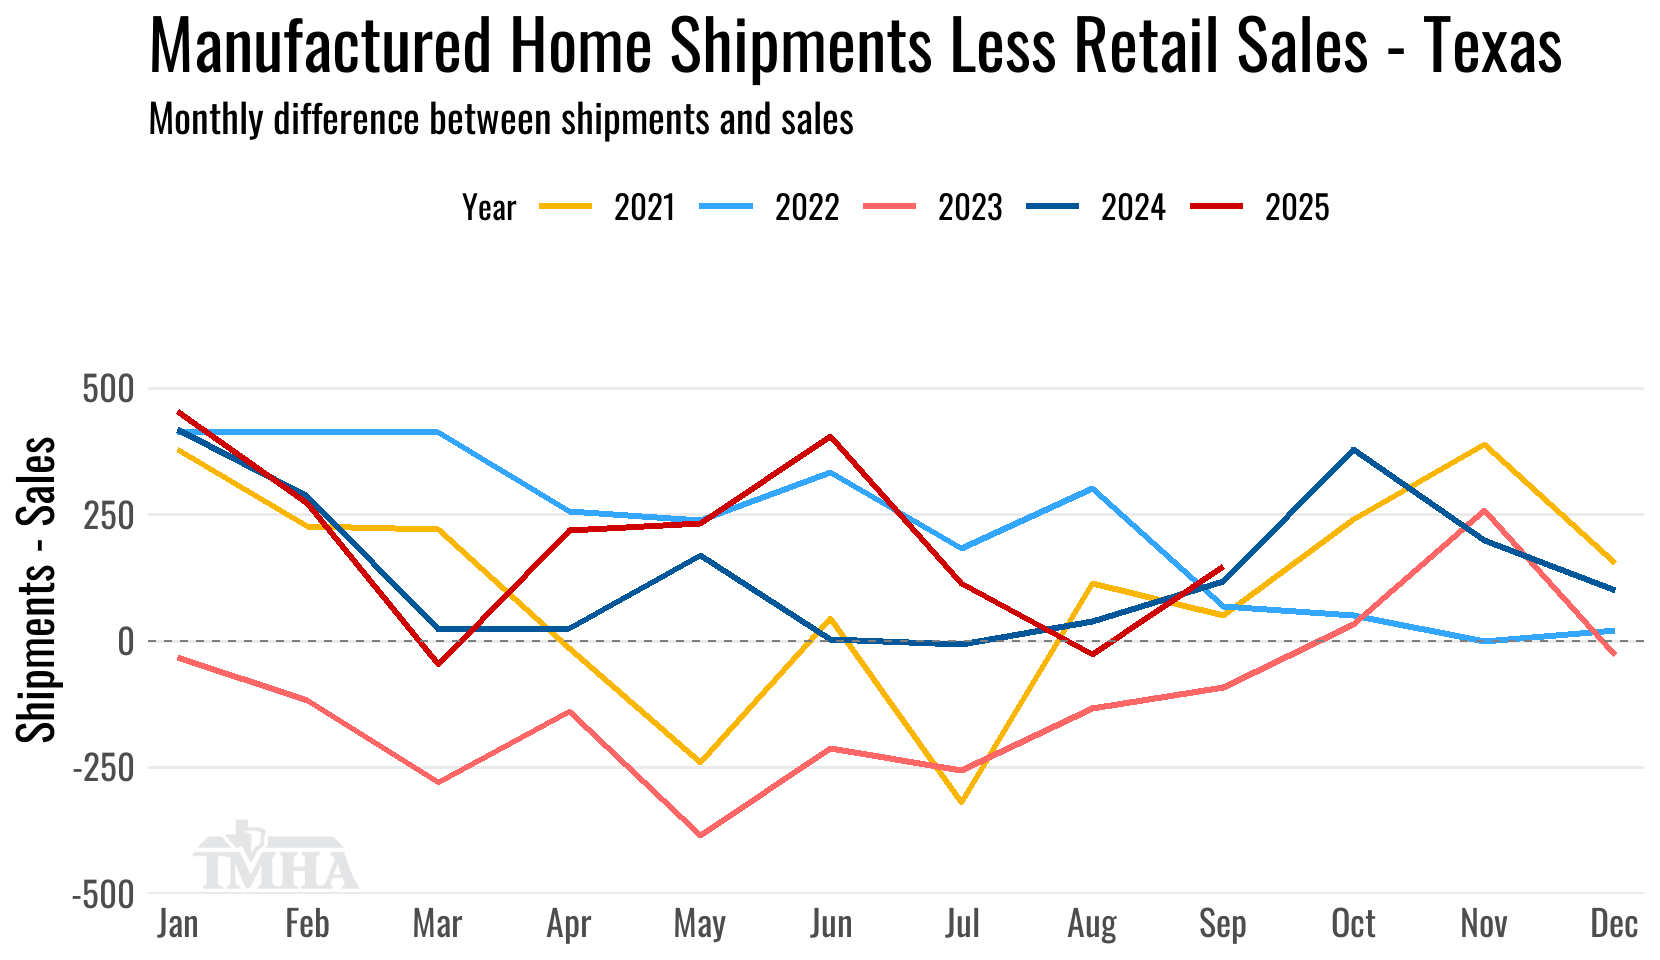
August marked the second time that retail sales outpaced shipments for a month in 2025. That usually occurs in July, but the shift in title cadence likely pushed what would have been reported July sales forward into August. The last third of the year is usually a period of aggregate inventory build up, so not having the typical drawdown in inventory that we usually see in July is putting downward pressure on shipments for the remainder of 2025 and into 2026.
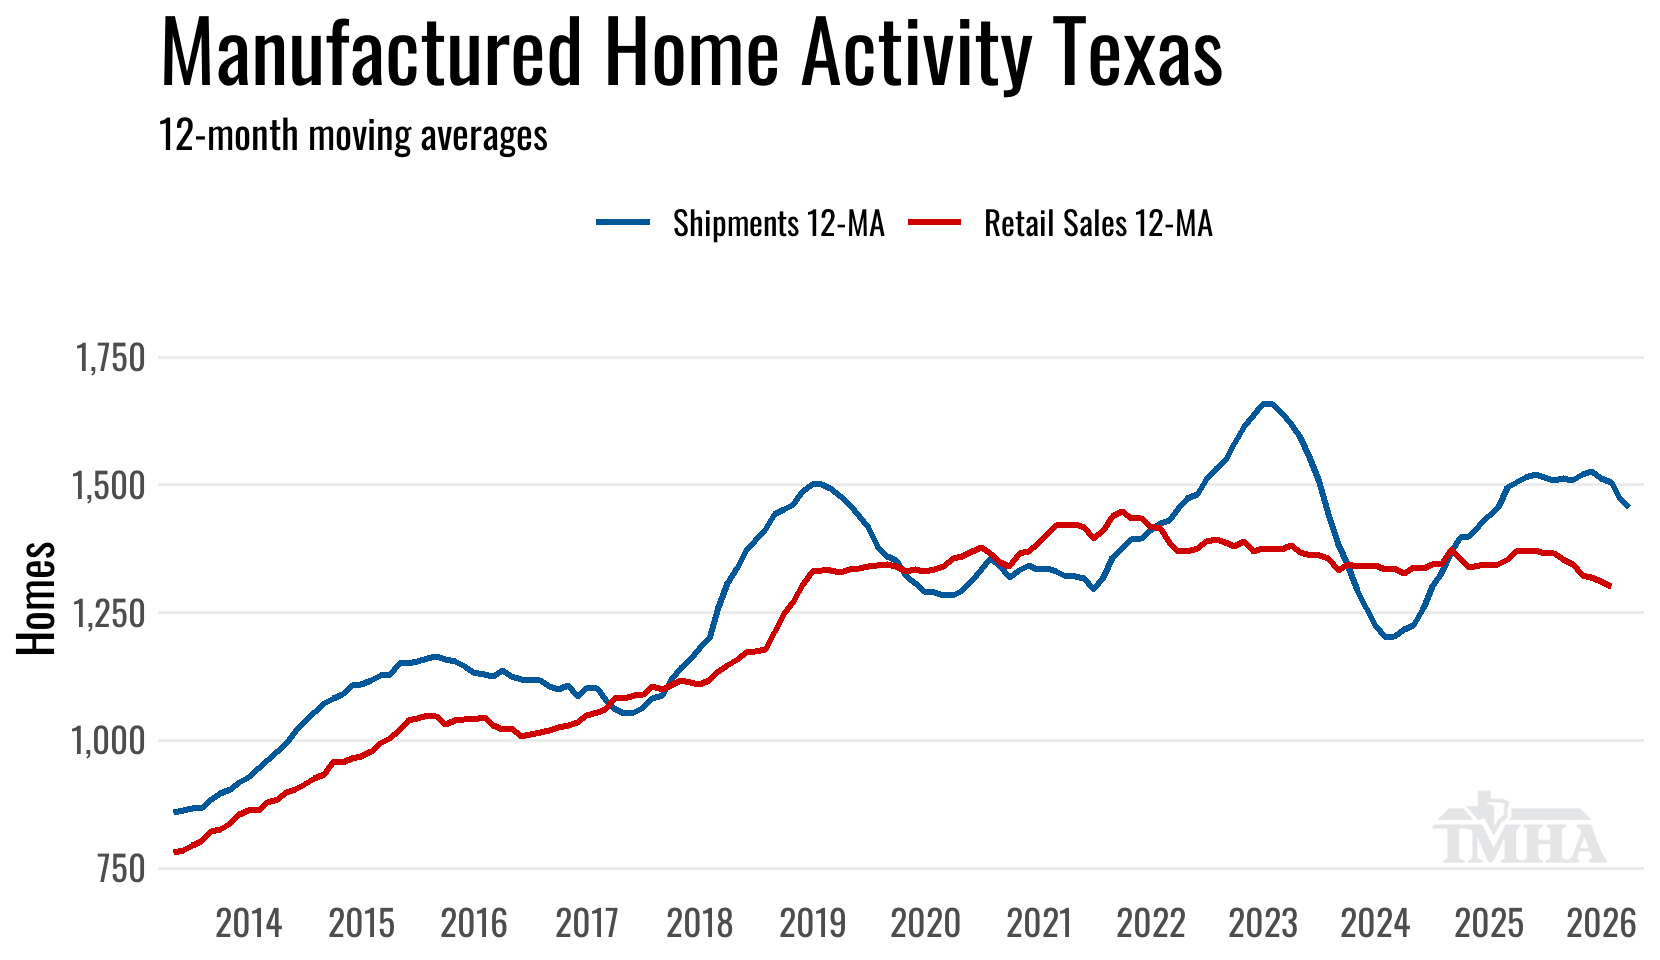
The 12-month moving average for shipments peaked in July of 2025 for this last production expansion cycle and has been moving lower through November.
The 12-month moving average for retail sales is currently plotted through September.
Used Homes
The used home retail sales data is noisy as it includes commercial purchases of park-owned homes after a manufacured home property is sold to a new buyer, but there has been a clear downward trend in total transactions in the higher interest rate environment from 2022 on.
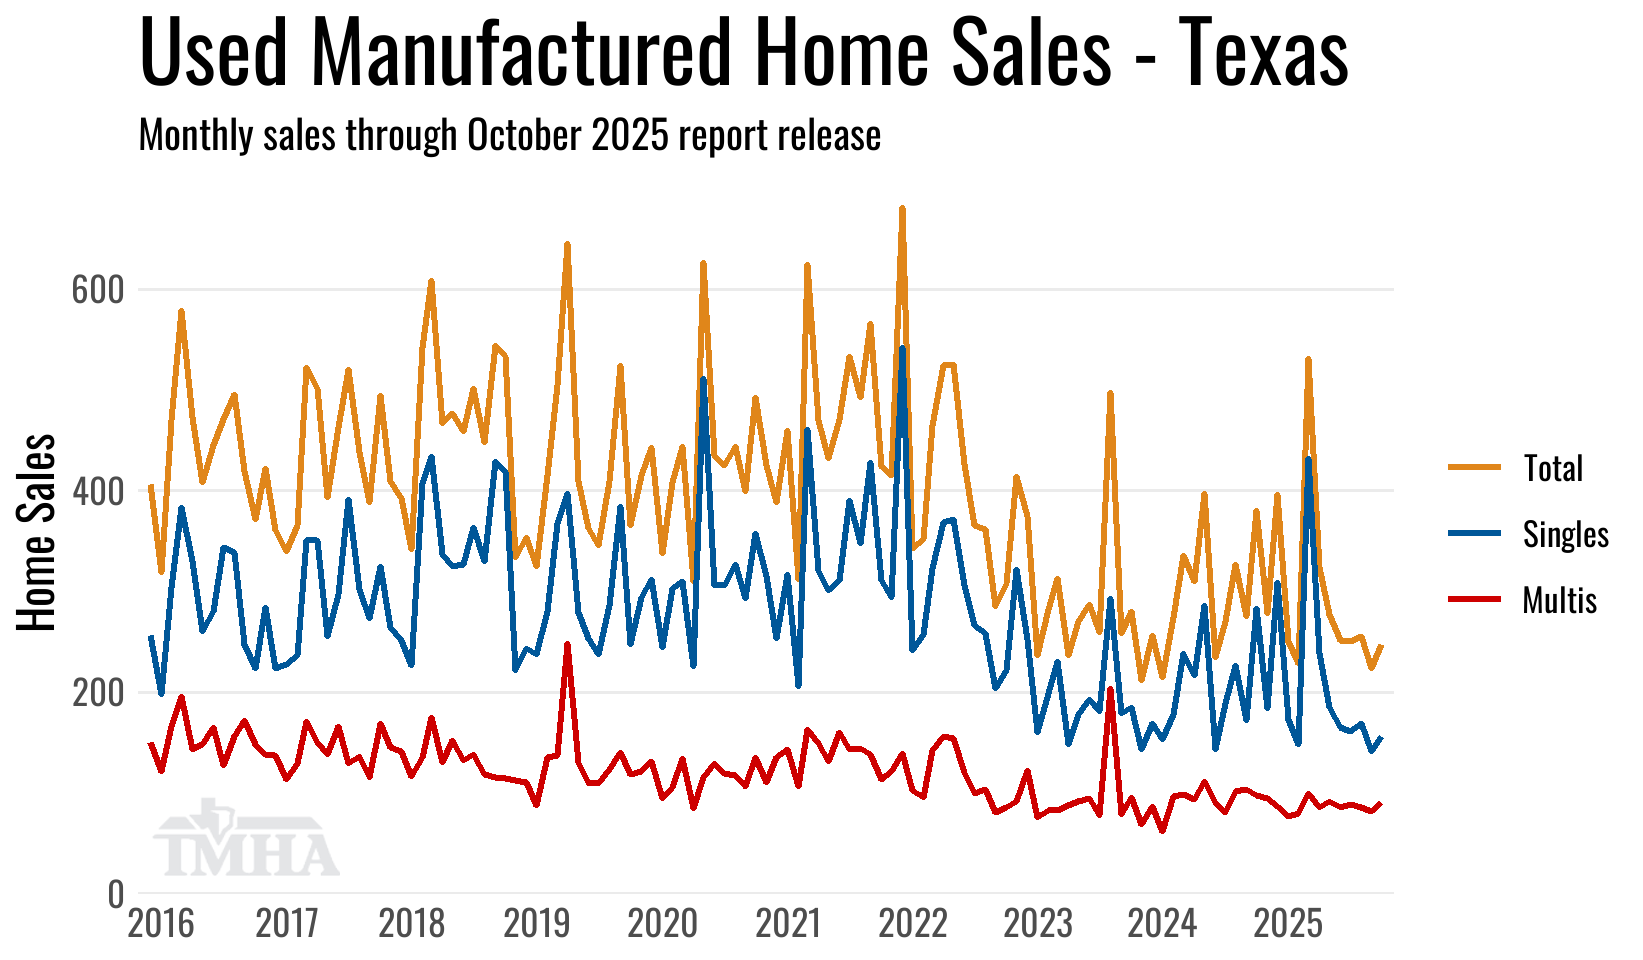
| Used Sales | Singles | Multis | Total |
|---|---|---|---|
| Total for 2025 titled to date: | 2,130 | 957 | 3,087 |
| Change from 2024 (%): | 17.5% | 12.3% | 15.8% |
| Change from 2024 (Units): | 317 | 105 | 422 |
Revised Monthly Totals
Because titles continue to come in for past sales months, here are all prior months for the year and what their current sales totals are at this report release.
| New Sales Month | Singles | Multis | Total | (YoY%) |
|---|---|---|---|---|
| January | 480 | 589 | 1,069 | 6.3 |
| February | 485 | 683 | 1,168 | -3.6 |
| March | 627 | 917 | 1,544 | 3.8 |
| April | 600 | 852 | 1,452 | -6.4 |
| May | 572 | 776 | 1,348 | -3.6 |
| June | 491 | 625 | 1,116 | -13.6 |
| July | 526 | 761 | 1,287 | 6.5 |
| August | 509 | 924 | 1,433 | 4.1 |
| September | 497 | 735 | 1,232 | 7.5 |
| Used Sales Month | Singles | Multis | Total | (YoY%) |
|---|---|---|---|---|
| January | 173 | 77 | 250 | 26.3 |
| February | 148 | 80 | 228 | -12.6 |
| March | 432 | 99 | 531 | 72.4 |
| April | 238 | 86 | 324 | 18.2 |
| May | 185 | 92 | 277 | -10.9 |
| June | 165 | 86 | 251 | 23.0 |
| July | 161 | 89 | 250 | 5.0 |
| August | 169 | 86 | 255 | 2.0 |
| September | 141 | 82 | 223 | -5.5 |