Texas Manufactured Housing Market Report - Sales Data & Analysis
Rob Ripperda
August
First Read
August is only about 43% titled at this point, but we can use installation reports to fill the gap. Installers’ Form-T filings reach TDHCA within days of the install, and a home’s installation tends to land a few days before its recorded transfer of ownership date. So the installations already reported for August give an early gauge of the month’s sales before the titles arrive.
Blending August’s titles issued to date with its installation reports points at roughly 1,360 new home sales (± 120) for the month. This first read will firm up considerably by next month’s early look.
The plot below shows how this method has scored so far. May’s First Read is holding, but the June and July calls have come down by 100 and 180 homes as those months filled in. The July early look below covers what changed, but installations ran ahead of titles in June and July of 2025 as well, so this may be a seasonal pattern the model cannot allow for until a second year confirms it.
A note on the plot: every diamond is now a true out-of-sample estimate, built only from the months that had settled by that date, with nothing later used to set the factors. Holding to what was knowable at the time shortens the scored record to start in December 2025 rather than August.
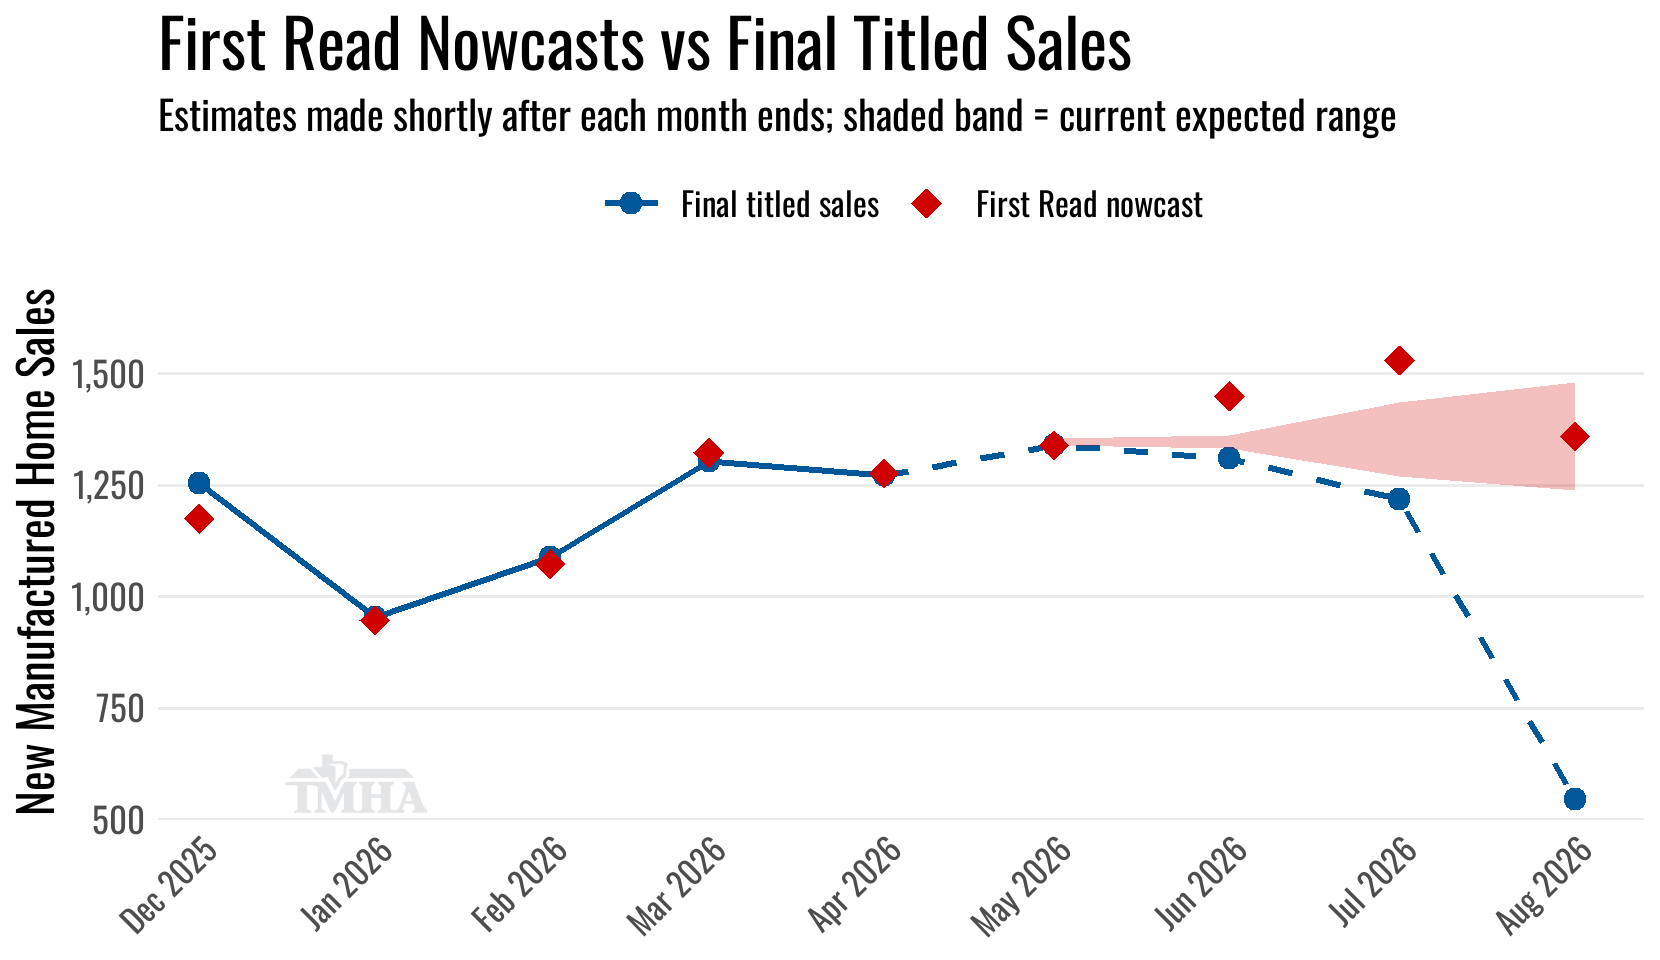
Note: Every diamond is the model’s First Read for that month. Months on the solid line are old enough for their totals to be effectively final. For the months still accumulating titles, the dashed line traces the titles actually issued so far and the shaded band shows the range where each is currently expected to settle, incorporating everything reported since its First Read.
July
Early Look
New manufactured home sales for July 2026 titled to date are so far up a seasonally-adjusted 4.9% from the previous month and are running 10.5% above July of 2025. This is the first early look to compare against the months where the change in title timing took hold a year ago. July of 2025’s early look jumped nearly 25% from June on the same basis, so most of the cadence inflation that flattered the last several year-over-year readings should now be washing out of the comparisons.
About 90% of a sale month’s eventual total is already on the books at this point in the reporting cycle. That puts July on pace to settle near 1,350 new home sales (± 80) once the remaining titles are issued. That would land within about 1.5% of July of 2025’s final total of 1,332, with the expected range straddling last year’s figure.
That is a sizeable step down from the roughly 1,500 our July First Read pointed at a month ago, and June has told the same story on a smaller scale, easing from a First Read near 1,450 to an estimate of about 1,350. July’s titles were issued unusually fast in the first two weeks of August, and July’s installation reports, at about 1,525, are running roughly 13% ahead of where the month’s sales now look to settle. That widening gap between installations and titles could be the community and rental channel discussed under the moving averages below, the seasonality mentioned above, or some of both.
As the plot below shows, July’s early count is still running above prior years at the same point, as is our titled-to-date count for August, but the 2025 line now lifts closer to the 2026 totals as last year’s faster titling kicks in.
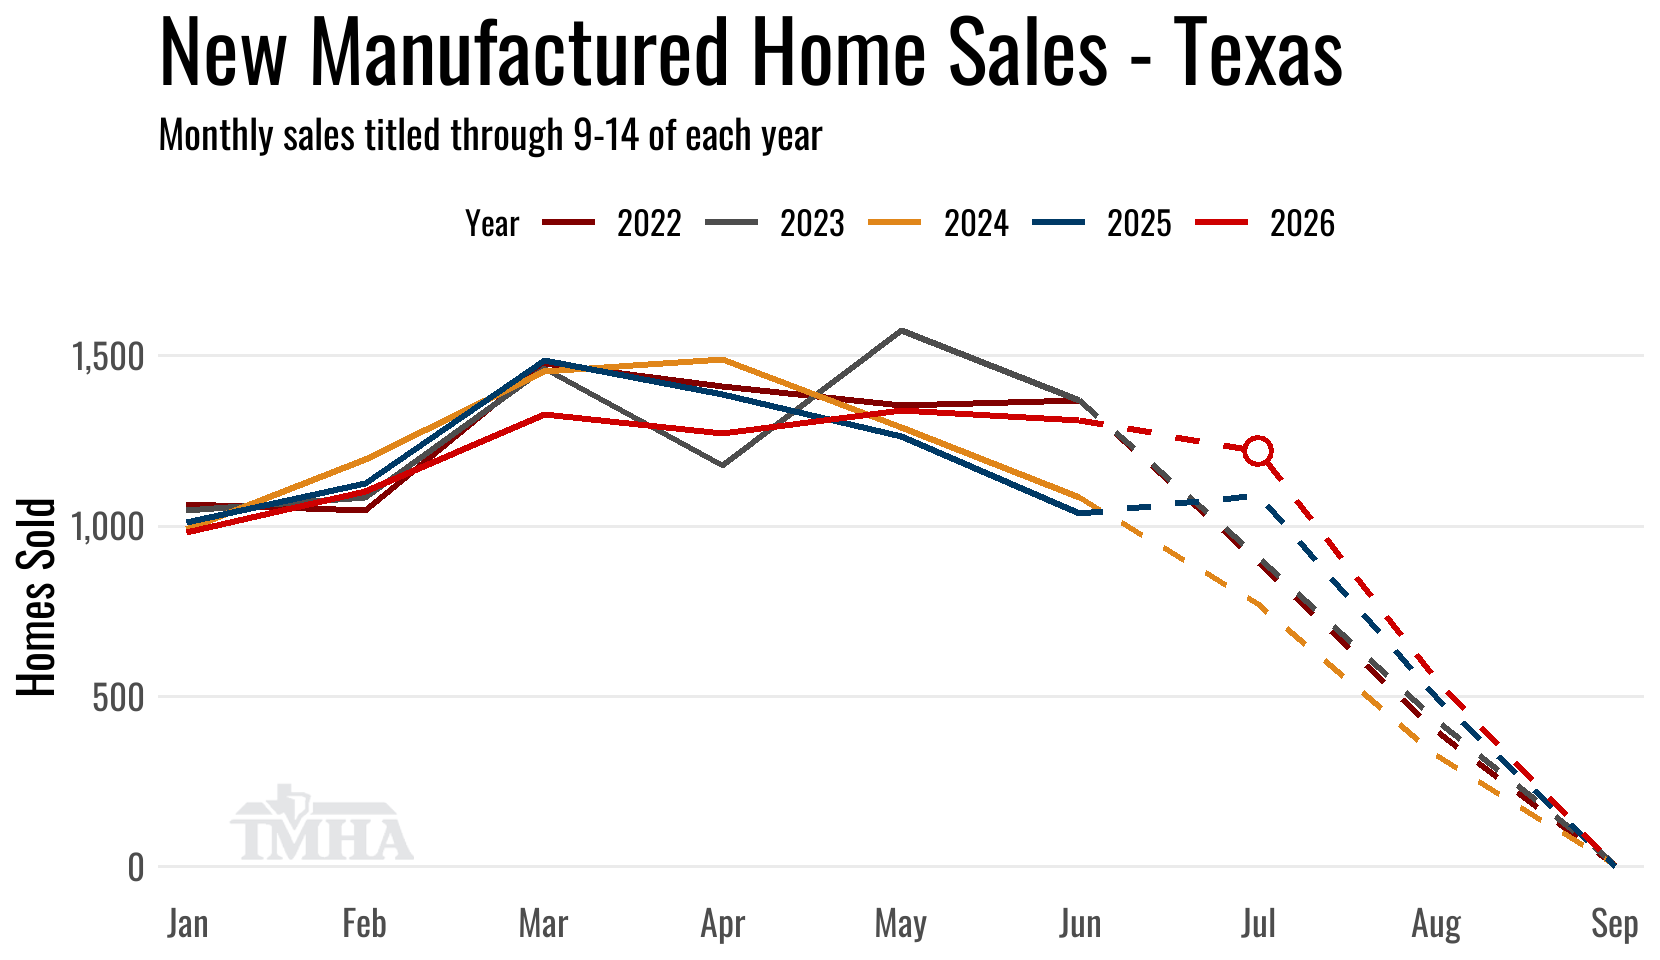
Solid lines represent months for which the on-time titling window has closed. Dashed lines are preliminary months for which titles are still being counted toward the reported total.
The comparisons in the table below are based on where the previous month’s numbers were when originally reported on one month ago.
| New Sales | Singles | Multis | Total |
|---|---|---|---|
| Total for July: | 414 | 805 | 1,219 |
| Change from June (Raw %): | -7.2% | 0.6% | -2.2% |
| Change from June (Raw Units): | -32 | 5 | -27 |
| Change from June (SA %): | -1% | 8.2% | 4.9% |
| Change from July of 2025 (%): | -7.6% | 22.9% | 10.5% |
| Change from July of 2025 (Units): | -34 | 150 | 116 |
TMHA Member’s Retailer Annual Sales Totals Report
June
Titled on Time
New home sales for June titled to date were down a seasonally adjusted 4.5% from the previous month and are up 26.2% on the raw total from June of 2025.
June’s 1,310 homes sold held nearly all of May’s gain, and the two months together are the strongest consecutive pair of on-time report months so far in 2026.
With June roughly 97% complete at publication, expect the month to settle near 1,350 new home sales (± 20) as the last titles are issued.
That settled estimate would land about 18% above June 2025’s final total of 1,145, a genuine gain rather than a cadence effect, since June of 2025 was the last month before the change in title timing took hold. Starting with next month’s report the comparisons run against the second half of 2025, after the enforcement change took hold, which should bring the year-over-year readings much closer to apples to apples.
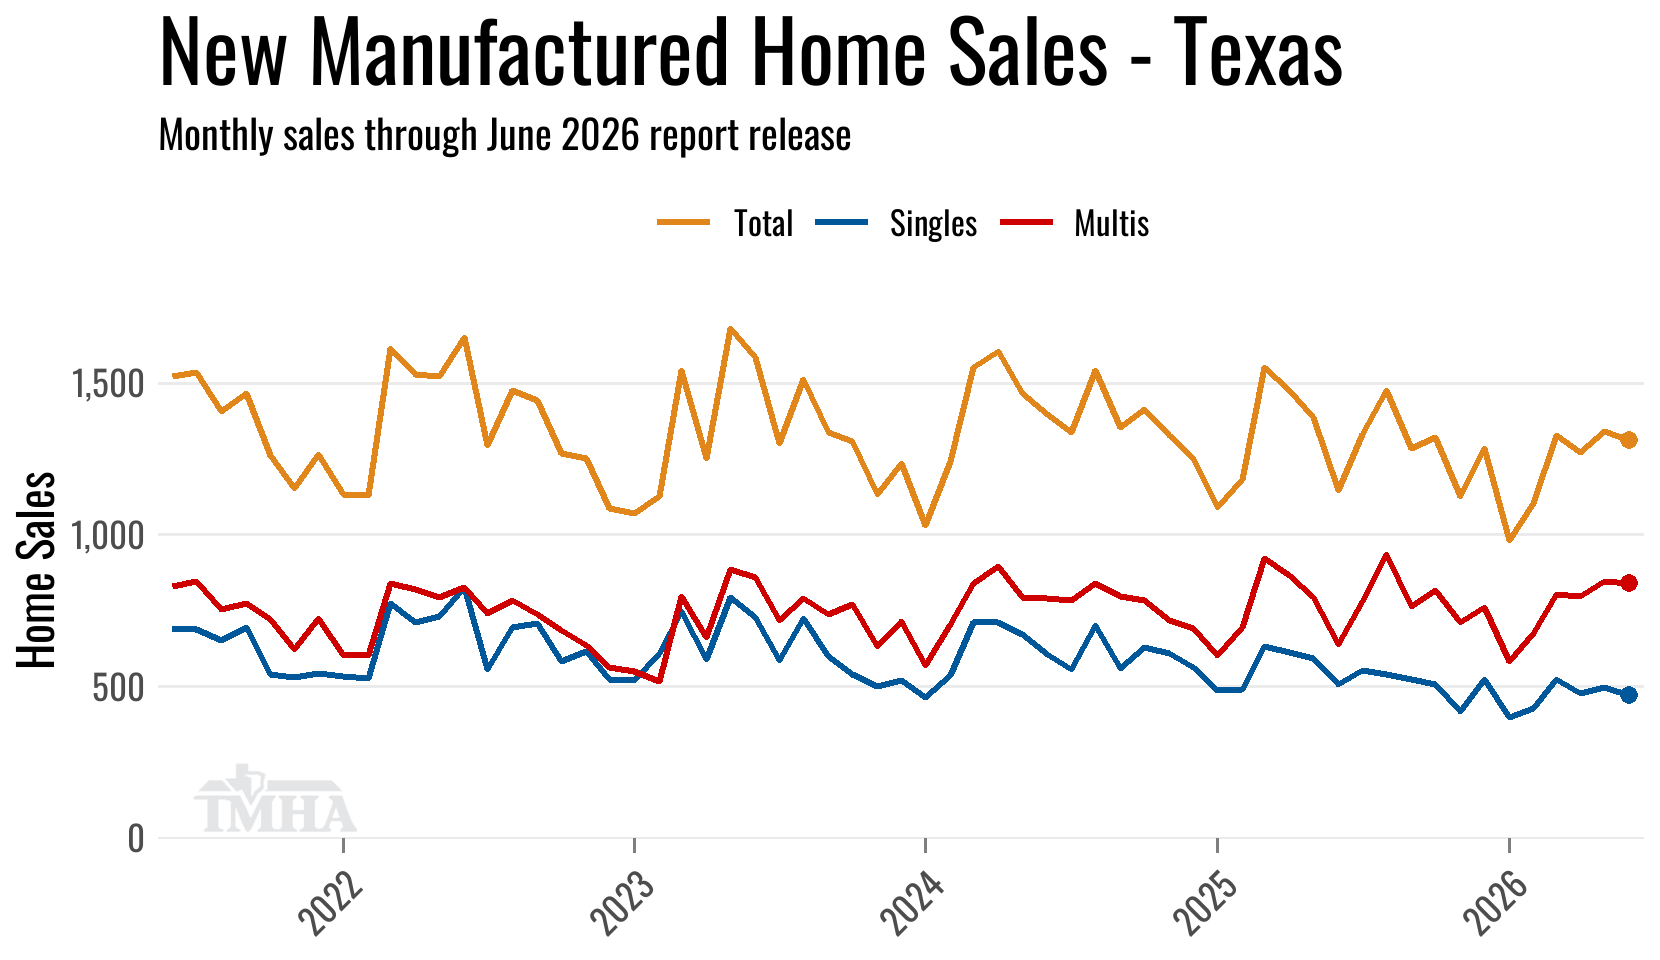
While the plot above contains revised totals for previous months the comparisons in the table below are based on where the previous month’s numbers were when released one month ago.
| New Sales | Singles | Multis | Total |
|---|---|---|---|
| Total for June: | 471 | 839 | 1,310 |
| Change from May (Raw %): | -2.3% | 0.7% | -0.4% |
| Change from May (Raw Units): | -11 | 6 | -5 |
| Change from May (SA %): | -4.8% | -2.9% | -4.5% |
| Change from June of 2025 (%): | 4.9% | 42.4% | 26.2% |
| Change from June of 2025 (Units): | 22 | 250 | 272 |
TMHA Member’s Retailer Monthly Sales Totals Report
Titled Installation Location Trends
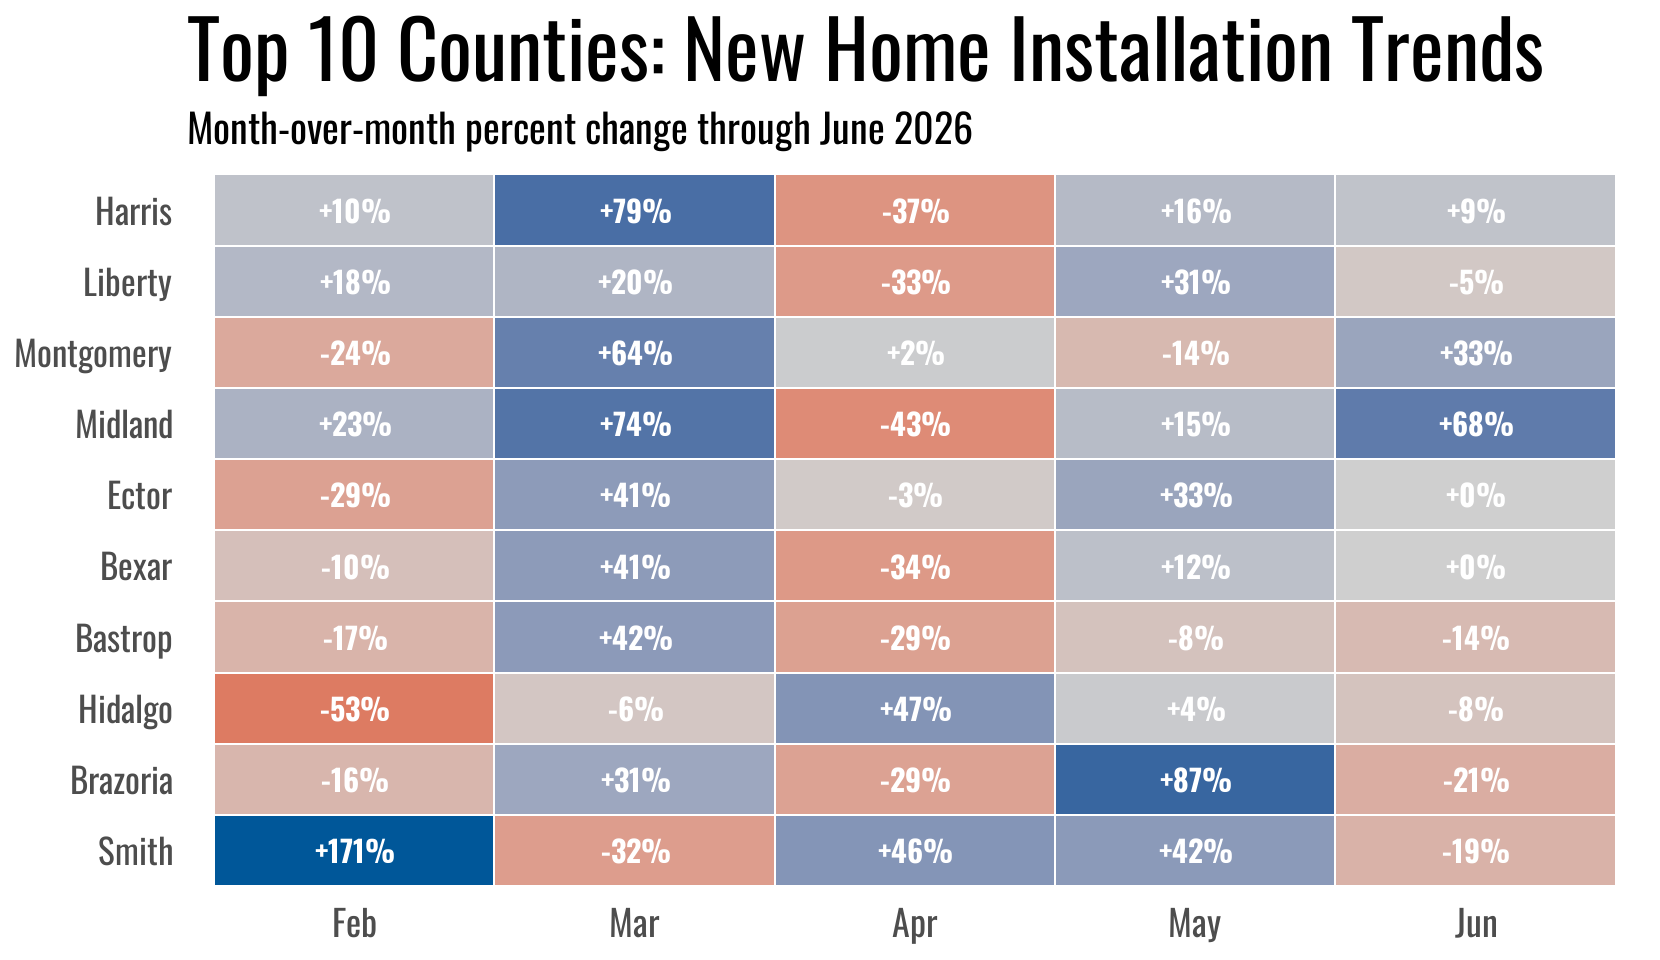
Here are the month-over-month changes for the top 10 counties for new home sales over the past five on-time report months, ranked by their total placements across that span.
June split the top ten. Midland jumped 68% to 52 homes, its best month in the window, Montgomery rose 33% and Harris 9%, while Ector and Bexar held flat. The other five slipped, led by Brazoria (down 21%), Smith (19%) and Bastrop (14%), with Hidalgo (8%) and Liberty (5%) easing only slightly.
TMHA Member’s Retailer Annual Sales Total per County Report
Annual Totals
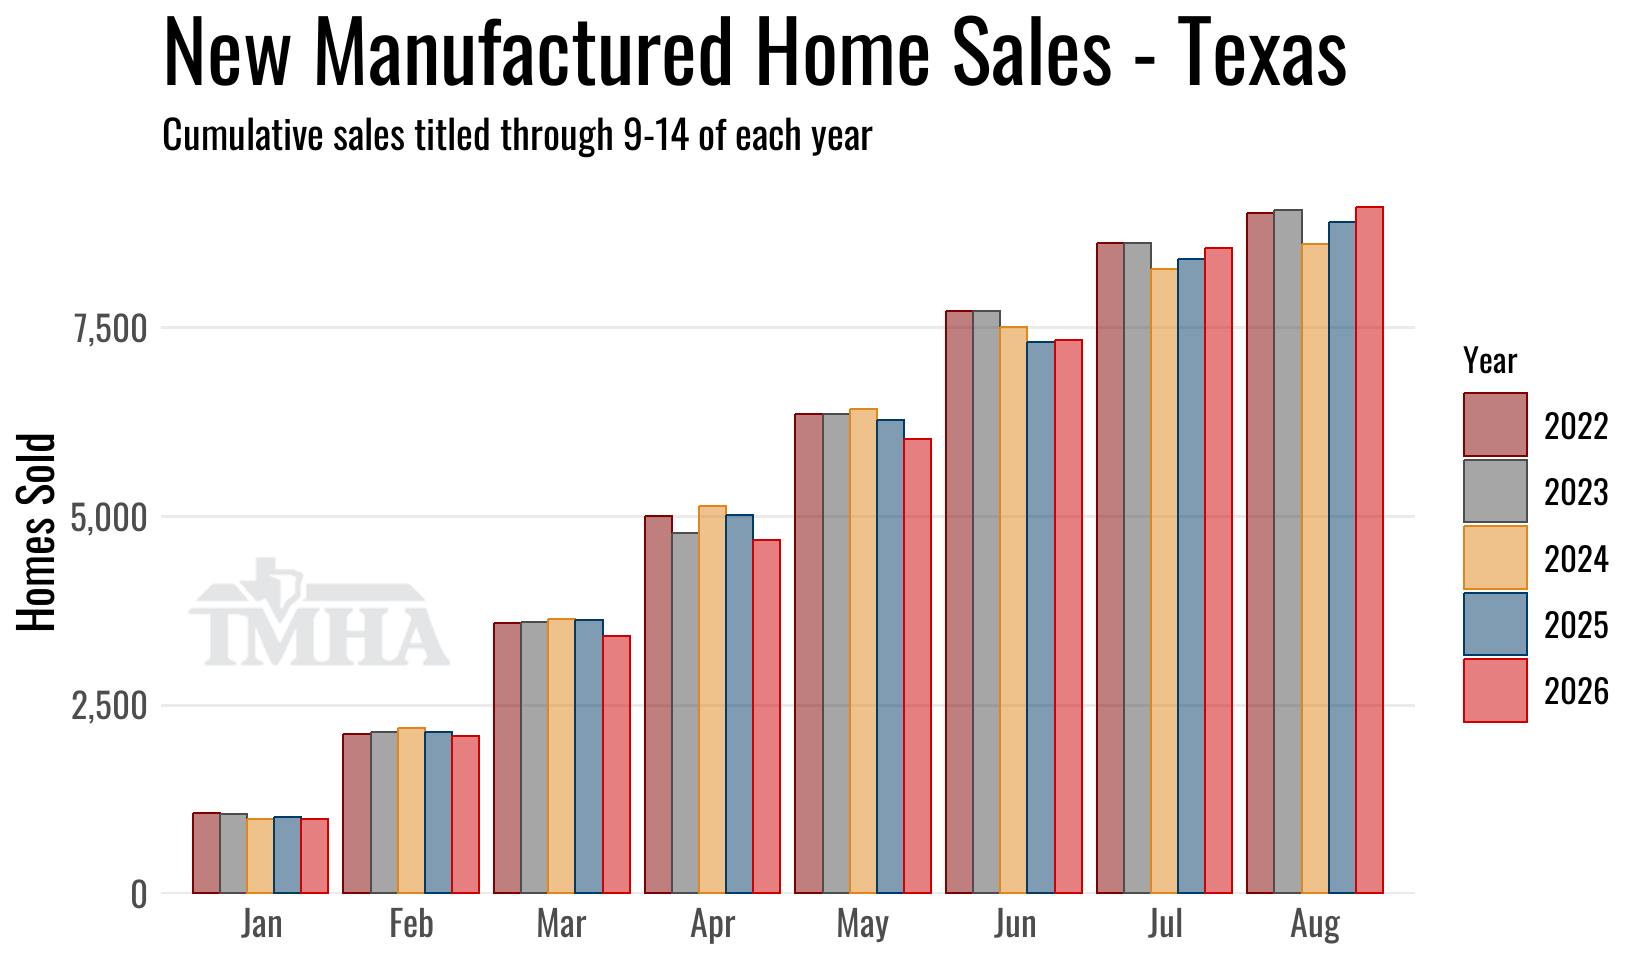
New home sales in 2026 are showing a 2.2% gain year-over-year for titles processed through this point compared to 2025.
Multi-section sales are up 8.5% year-over-year while single-section sales are down 6.8%.
As noted above, the titling phase shift should be inflating 2026 year-over-year comparisons somewhat through this first half of 2026, but some of that is simply pushing sales into June and July that a year ago would have been tallied as revisions to earlier months. The effect shouldn’t be as pronounced at the cumulative annual total as it is at the comparative month level.
We can also look at the statewide installation reports which are running 2.4% below last year’s pace year-to-date. That is a useful check on 2026’s current lead on previous years: it’s faster titling, not a surge of homes going into the ground.
| New Sales | Singles | Multis | Total |
|---|---|---|---|
| Total for 2026 titled to date: | 3,388 | 5,710 | 9,098 |
| Change from 2025 (%): | -6.8% | 8.5% | 2.2% |
| Change from 2025 (Units): | -249 | 448 | 199 |
TMHA Member’s Retailer Annual Sales Totals Report
New Home Characteristics
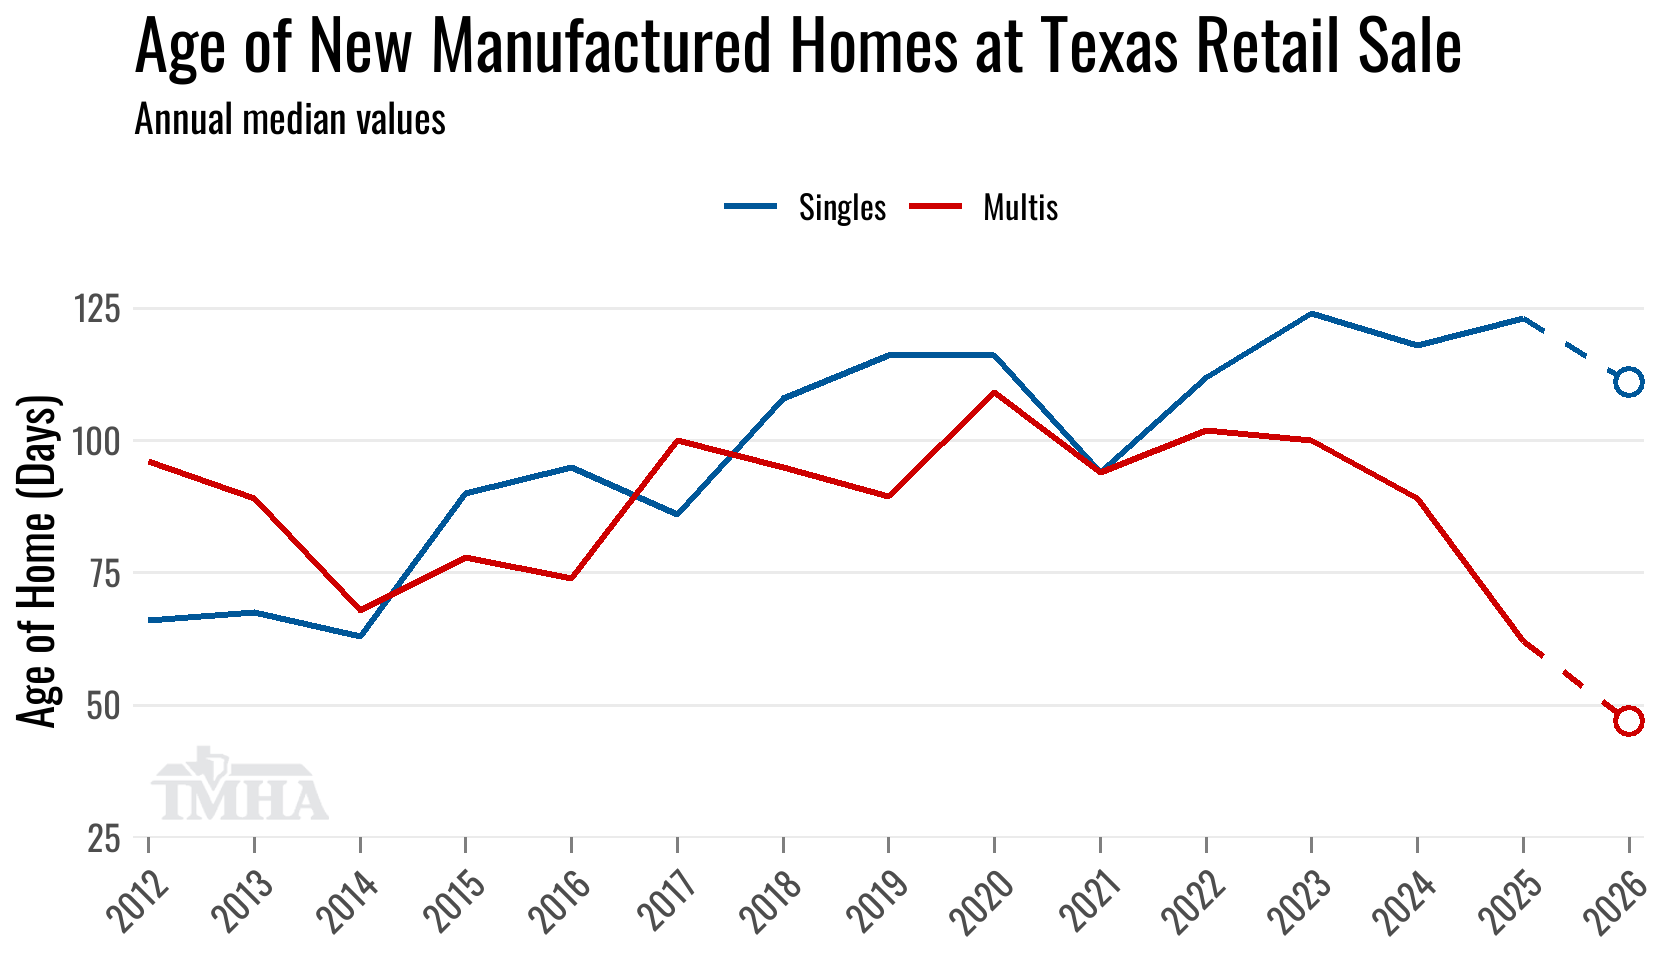
The shift in title cadence has really pulled down the median age of multi-section homes to the shortest amount of days in our records, and single-section homes are following, if less smoothly. June set the low for the year at 81 days on the on-time basis, still well short of the multi-section median of 49 days. April and June are the two lowest single-section readings since the cadence change, which says single-section inventory genuinely is turning faster, even if the month-to-month path is noisy. Given how much the median has moved for multi-section homes, we suspect the change in date of sale guidance had an outsized effect on those home sale transactions, but the single-section market has also underperformed the multi-section market for several years now, so it makes sense those homes had been taking longer to turn.
| New Home Characteristics for 2026 | Singles | Multis | Total |
|---|---|---|---|
| Median Age of Home (Days): | 111 | 47 | 64 |
| Median Square Footage: | 1,080 | 1,717 | 1,475 |
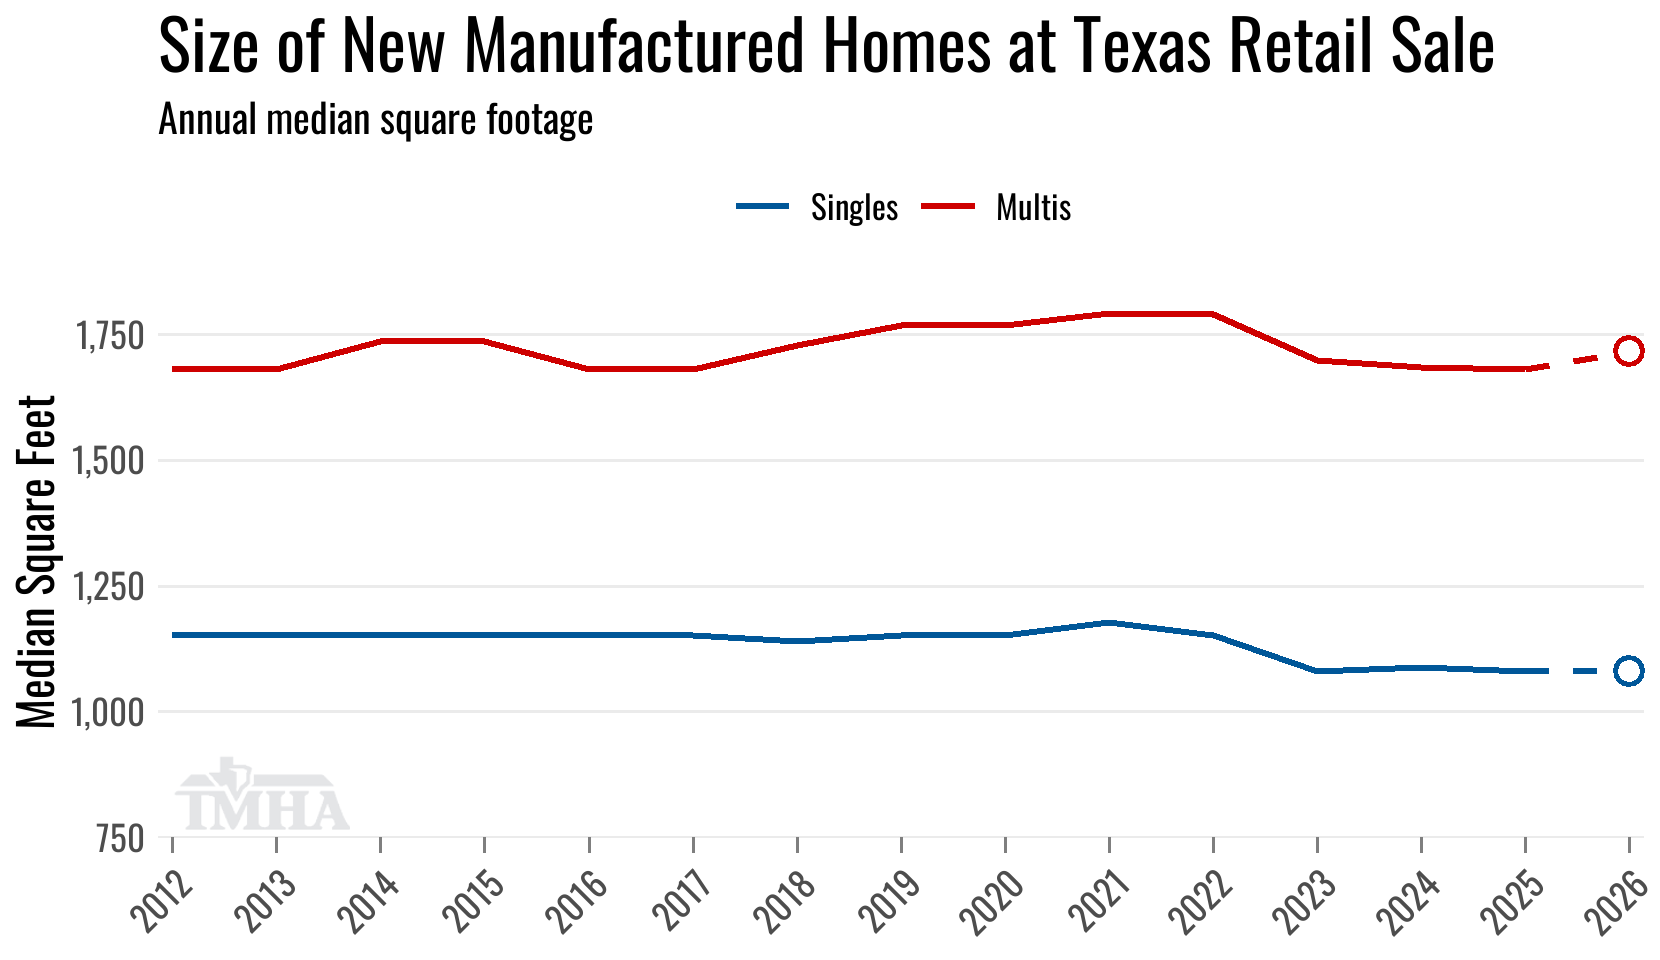
Beyond the age of homes at purchase, the square footage plot below shows a structural shift in Texans downsizing new home purchases when the affordability squeeze set in. The break is sharp and lands in a single year: both section types held their long-run size through 2022 and stepped down together in 2023. Multi-section medians moved from roughly 1,790 square feet to about 1,700, and single-section homes from roughly 1,150 to 1,080, where both have held since. Multis are running 1,717 so far this year, a modest uptick, though 2026 is a partial year and still settling.
New Home Placement Locations
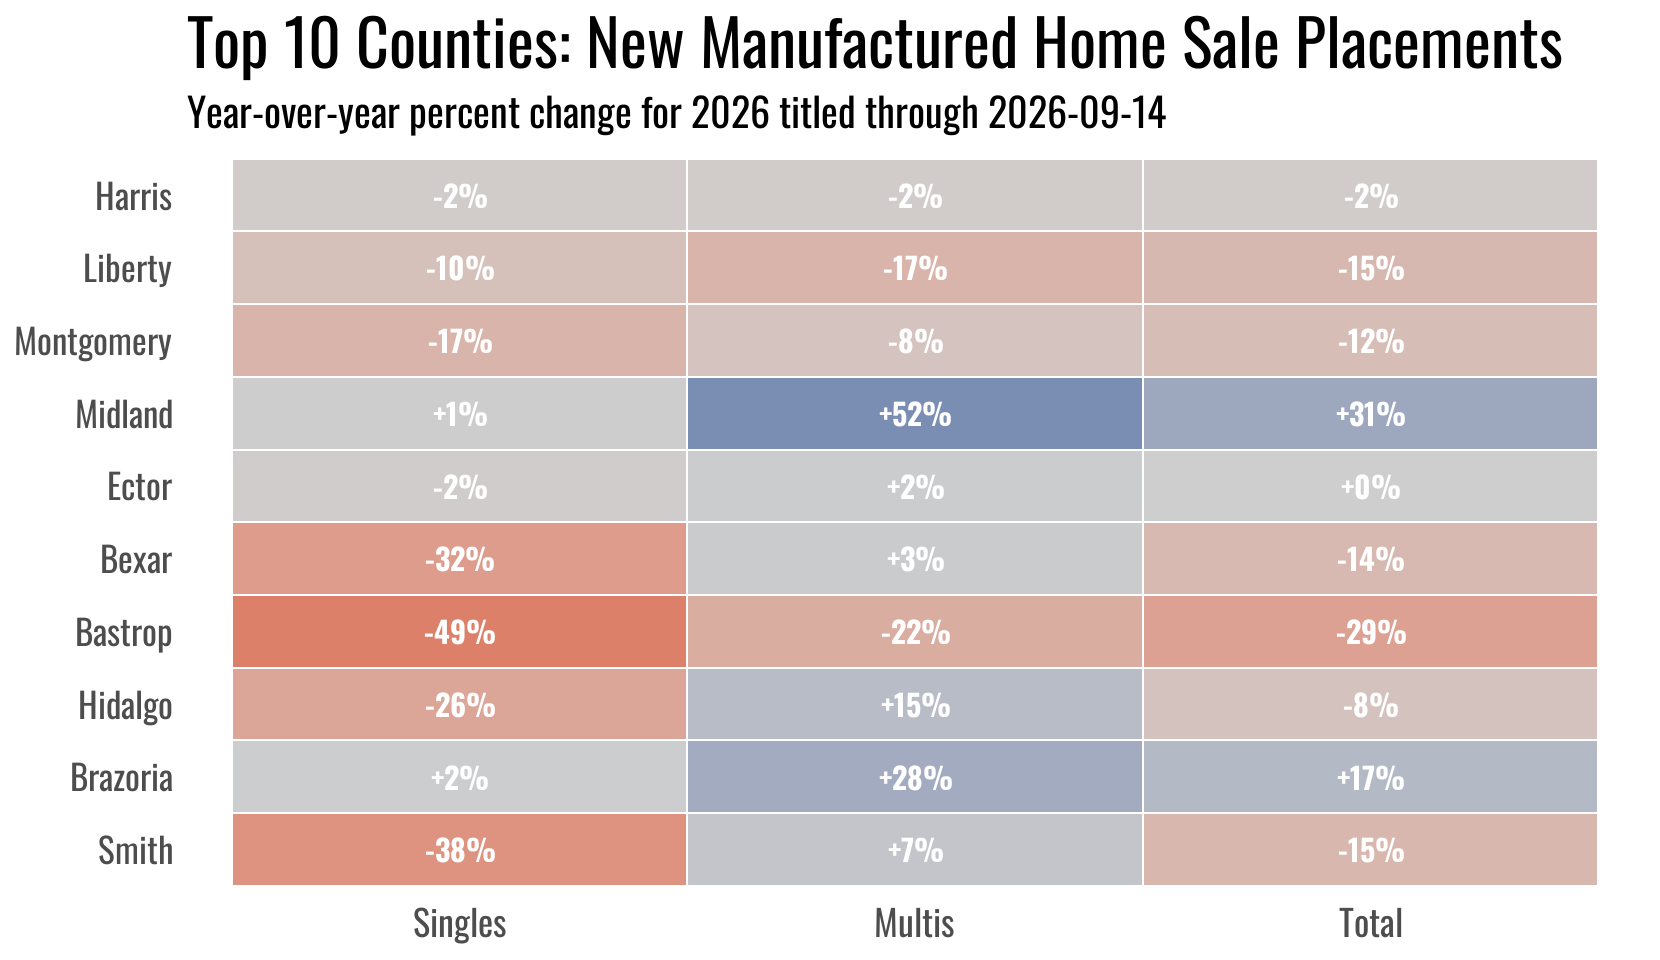
Here are the breakdowns in year-over-year changes for the top 10 counties in new home placements across home section types.
Midland, now fourth in volume, leads the top 10 in year-over-year growth at +31.4%, well clear of Brazoria at +16.9%; Ector (+0.4%) is the only other county holding last year’s pace through September 14. The remaining seven are behind, with Bastrop down 28.9%, Smith down 15.0% and Liberty down 14.5% showing the steepest declines.
TMHA Member’s Total Annual Retail Sales per County Report
Shipment Comparison
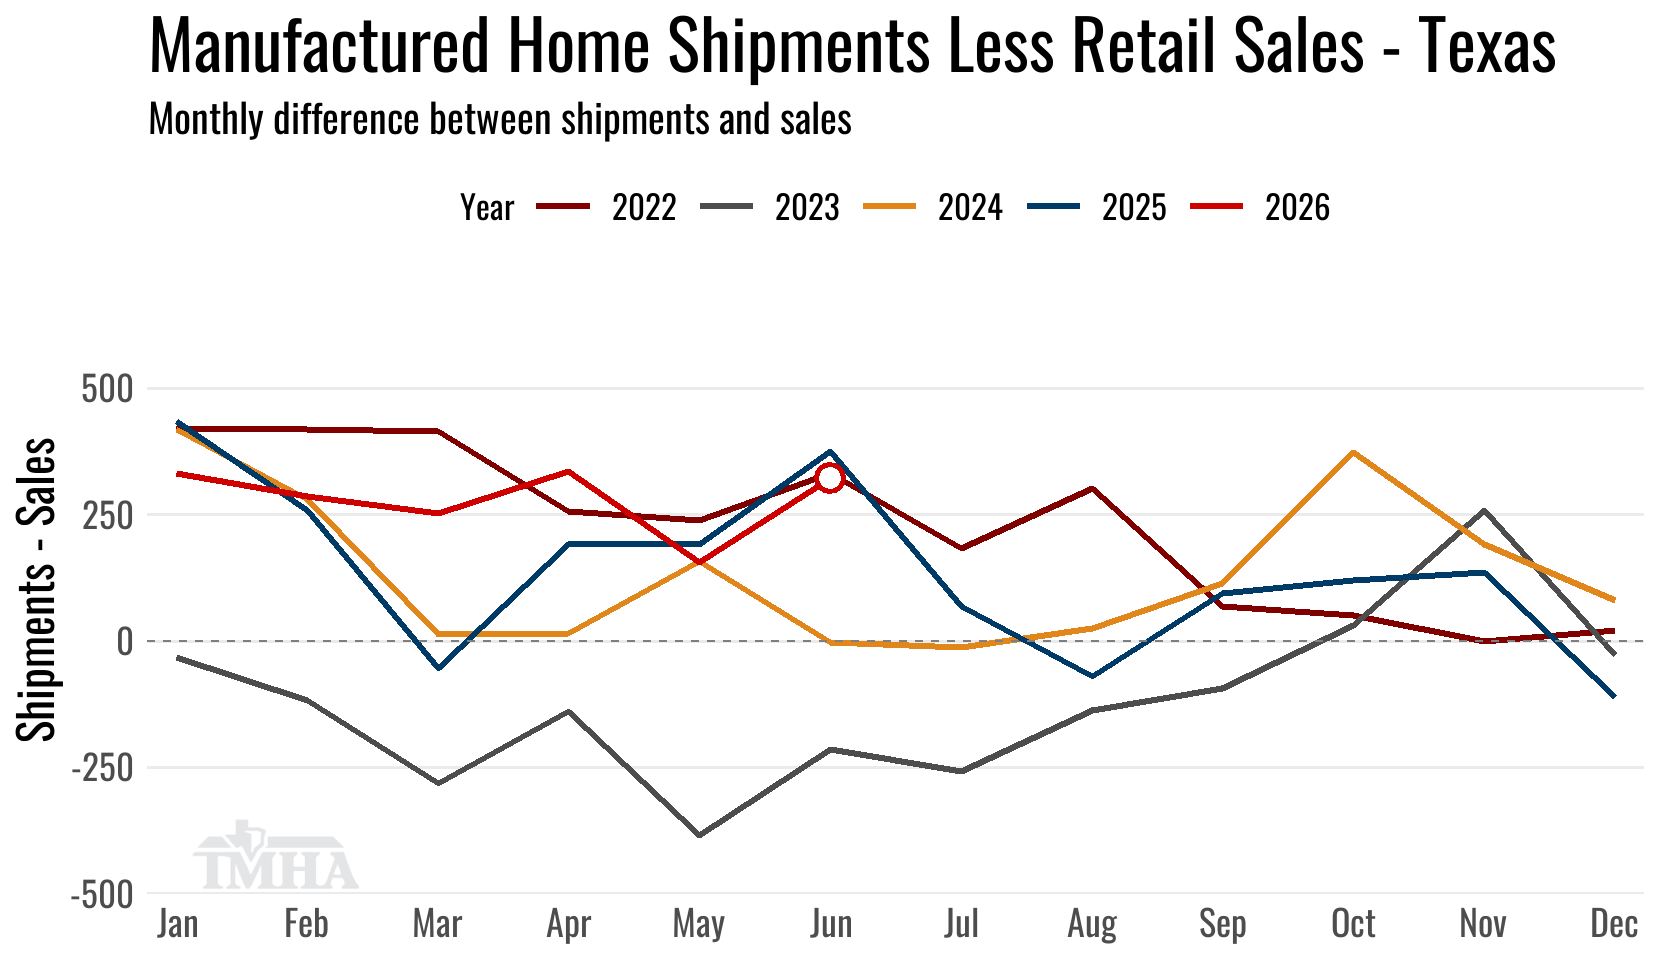
The gap between shipments and titled retail sales reopened in June. May’s difference settled at 156 homes once its late titles arrived, but June’s 1,631 shipments, the strongest month of 2026 so far, ran 321 ahead of the 1,310 new home sales titled for the month, back in the 250 to 335 range that held from January through April. June is close enough to complete that its remaining titles will trim that by only a few dozen. July’s early look points the same way: 1,448 shipments against 1,219 sales titled to date leaves a 229-home difference that should narrow to roughly 100 as July’s remaining titles arrive, close to the 68-home gap of July 2025.
Moving Averages
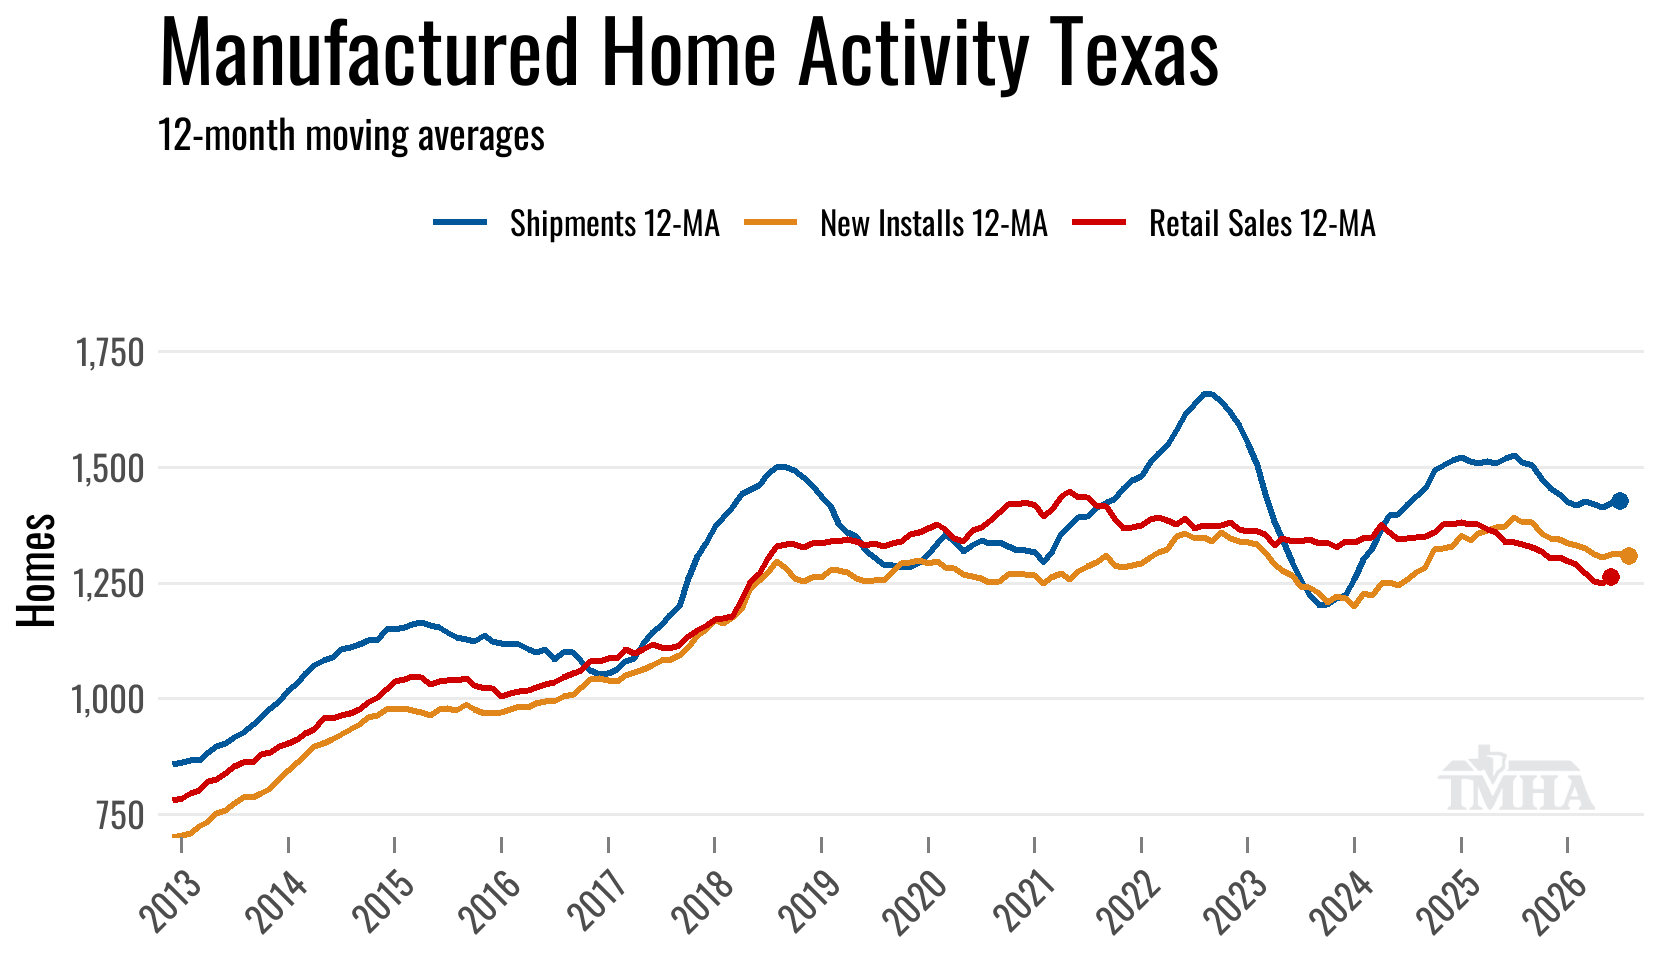
The plot below shows the 12-month moving averages for manufactured home shipments, retail sold titles, and new home installations. We recently added the new home installation series that shows more support for shipments than the retail title series was depicting alone. Some of that installation increase is from new manufactured home communities that were placing homes into their inventory and rental stock that have not yet been titled. Some of those homes go from being rentals to used home purchases which don’t show up in the retail sales line that is limited to titles designated as new homes. We will continue to research how to best account for the community channel’s impact on aggregate retail sales totals. The shipments line runs through July, retail sales through June and installations through August.
Used Homes
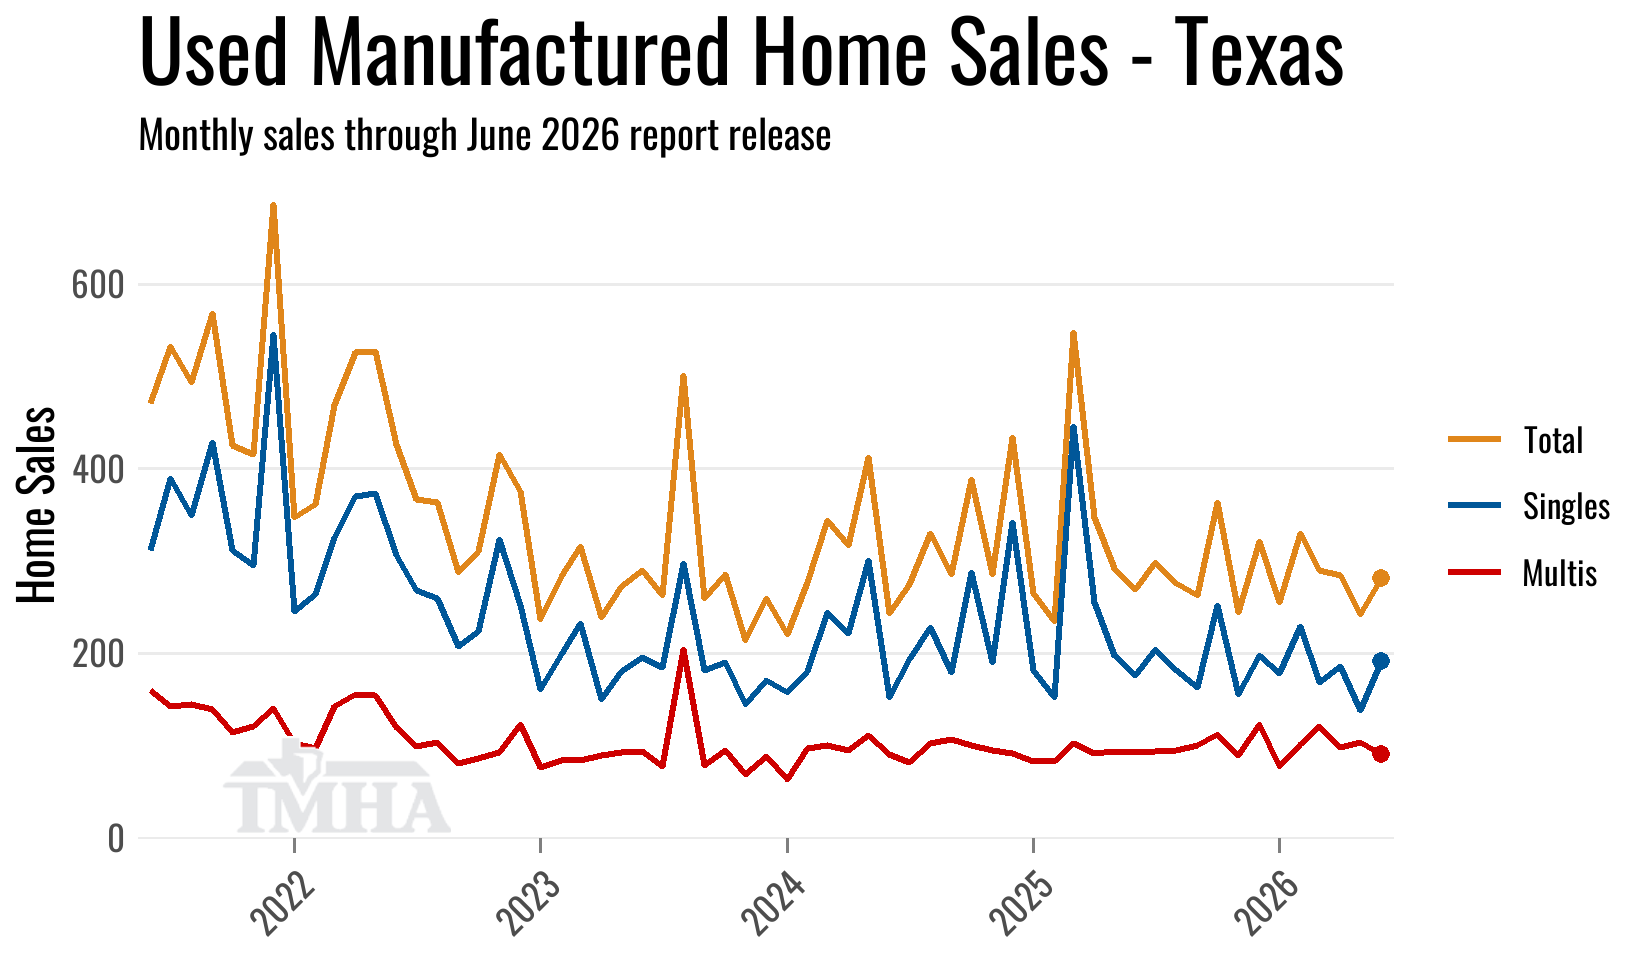
The used home retail sales data is noisy as it includes commercial purchases of park-owned homes after a manufactured home property is sold to a new buyer, but there was a clear downward trend in total transactions in the higher interest rate environment from 2022 through 2024 and have been roughly flat since.
| Used Sales | Singles | Multis | Total |
|---|---|---|---|
| Total for 2026 titled to date: | 1,279 | 710 | 1,989 |
| Change from 2025 (%): | -7.1% | 22.6% | 1.7% |
| Change from 2025 (Units): | -98 | 131 | 33 |
Revised Monthly Totals
Because titles continue to come in for past sales months, here are the prior 12 months and what their current sales totals are at this report release.
| New Sales Month | Singles | Multis | Total | (YoY%) |
|---|---|---|---|---|
| May 2026 | 495 | 845 | 1,340 | 6.0 |
| April 2026 | 476 | 797 | 1,273 | -8.2 |
| March 2026 | 523 | 804 | 1,327 | -10.8 |
| February 2026 | 426 | 676 | 1,102 | -2.0 |
| January 2026 | 398 | 582 | 980 | -3.2 |
| December 2025 | 523 | 761 | 1,284 | 7.4 |
| November 2025 | 417 | 711 | 1,128 | -13.1 |
| October 2025 | 506 | 815 | 1,321 | -5.4 |
| September 2025 | 522 | 764 | 1,286 | -2.3 |
| August 2025 | 540 | 937 | 1,477 | -0.5 |
| July 2025 | 553 | 779 | 1,332 | 2.3 |
| June 2025 | 507 | 638 | 1,145 | -15.1 |
| Used Sales Month | Singles | Multis | Total | (YoY%) |
|---|---|---|---|---|
| May 2026 | 138 | 104 | 242 | -4.0 |
| April 2026 | 186 | 98 | 284 | -7.5 |
| March 2026 | 169 | 121 | 290 | -38.6 |
| February 2026 | 229 | 101 | 330 | 49.3 |
| January 2026 | 178 | 77 | 255 | 5.4 |
| December 2025 | 198 | 123 | 321 | -18.9 |
| November 2025 | 155 | 89 | 244 | -7.6 |
| October 2025 | 252 | 112 | 364 | -3.4 |
| September 2025 | 163 | 100 | 263 | -5.4 |
| August 2025 | 181 | 95 | 276 | -14.0 |
| July 2025 | 204 | 94 | 298 | 12.9 |
| June 2025 | 176 | 93 | 269 | 17.0 |