Texas Manufactured Housing Market Report September 2025 - Sales Data & Analysis
Rob Ripperda
September
Early Look
New manufactured home sales in September titled to date are down a seasonally-adjusted -8.3% from the previous month. Note that the preceding two months of July and August were the first impacted by the change in Statement of Ownership (SO) cadence as retailers aligned to the Manufactured Housing Division of Texas Department of Housing and Community Affairs clarification and subsequent rule adoption on what date to use to signify the complete transfer of ownership of the home to the consumer. This change in cadence will impact monthly comparisons for some time until a new normal is established and will add additional noise to the comparisons to past months.
The year-over-year comparisons will be particularly impacted as we see again for September which is currently tracking +37.3% over September of 2024.
| New Sales | Singles | Multis | Total |
|---|---|---|---|
| Total for September: | 470 | 690 | 1,160 |
| Change from August (Raw %): | 2.2% | -19.4% | -11.9% |
| Change from August (Raw Units): | 10 | -166 | -156 |
| Change from August (SA %): | 1.4% | -15% | -8.3% |
| Change from September of 2024 (%): | 29.5% | 43.2% | 37.3% |
| Change from September of 2024 (Units): | 107 | 208 | 315 |
| Used Sales | Singles | Multis | Total |
|---|---|---|---|
| Total for September: | 117 | 70 | 187 |
| Change from August (Raw %): | -15.8% | -7.9% | -13% |
| Change from August (Raw Units): | -22 | -6 | -28 |
| Change from August (SA %): | 5.7% | -0.2% | 4.3% |
| Change from September of 2024 (%): | 18.2% | 16.7% | 17.6% |
| Change from September of 2024 (Units): | 18 | 10 | 28 |
August
Titled On Time
New home sales for August titled to date are up a seasonally adjusted +4.2% from the previous month and are up +13.2% on the raw total from August of 2024.
There was a large increase in the number of homes sold into Liberty County which led the state in new manufactured home sales for August.
| New Sales | Singles | Multis | Total |
|---|---|---|---|
| Total for August: | 487 | 896 | 1,383 |
| Change from July (Raw %): | -3.6% | 22.1% | 11.6% |
| Change from July (Raw Units): | -18 | 162 | 144 |
| Change from July (SA %): | -5.6% | 20% | 4.2% |
| Change from August of 2024 (%): | -15% | 38.1% | 13.2% |
| Change from August of 2024 (Units): | -86 | 247 | 161 |
| New Home Characteristics for August | Singles | Multis | Total |
|---|---|---|---|
| Median Age of Home (Days): | 103 | 47 | 63 |
| Median Square Footage: | 1,080 | 1,685 | 1,475 |
| Top 10 Counties for New Installs | Total | Change (MoM%) |
|---|---|---|
| Liberty | 66 | 65% |
| Montgomery | 48 | 9.1% |
| Harris | 39 | -15.2% |
| Bastrop | 37 | 12.1% |
| Bexar | 35 | 25% |
| Midland | 29 | -12.1% |
| Tarrant | 29 | 31.8% |
| Ector | 28 | -12.5% |
| Hidalgo | 24 | 20% |
| Henderson | 21 | 31.2% |
| Used Sales | Singles | Multis | Total |
|---|---|---|---|
| Total for August: | 152 | 83 | 235 |
| Change from July (Raw %): | 7% | 3.8% | 5.9% |
| Change from July (Raw Units): | 10 | 3 | 13 |
| Change from July (SA %): | -3.3% | -1.7% | -2.8% |
| Change from August of 2024 (%): | -0.7% | 18.6% | 5.4% |
| Change from August of 2024 (Units): | -1 | 13 | 12 |
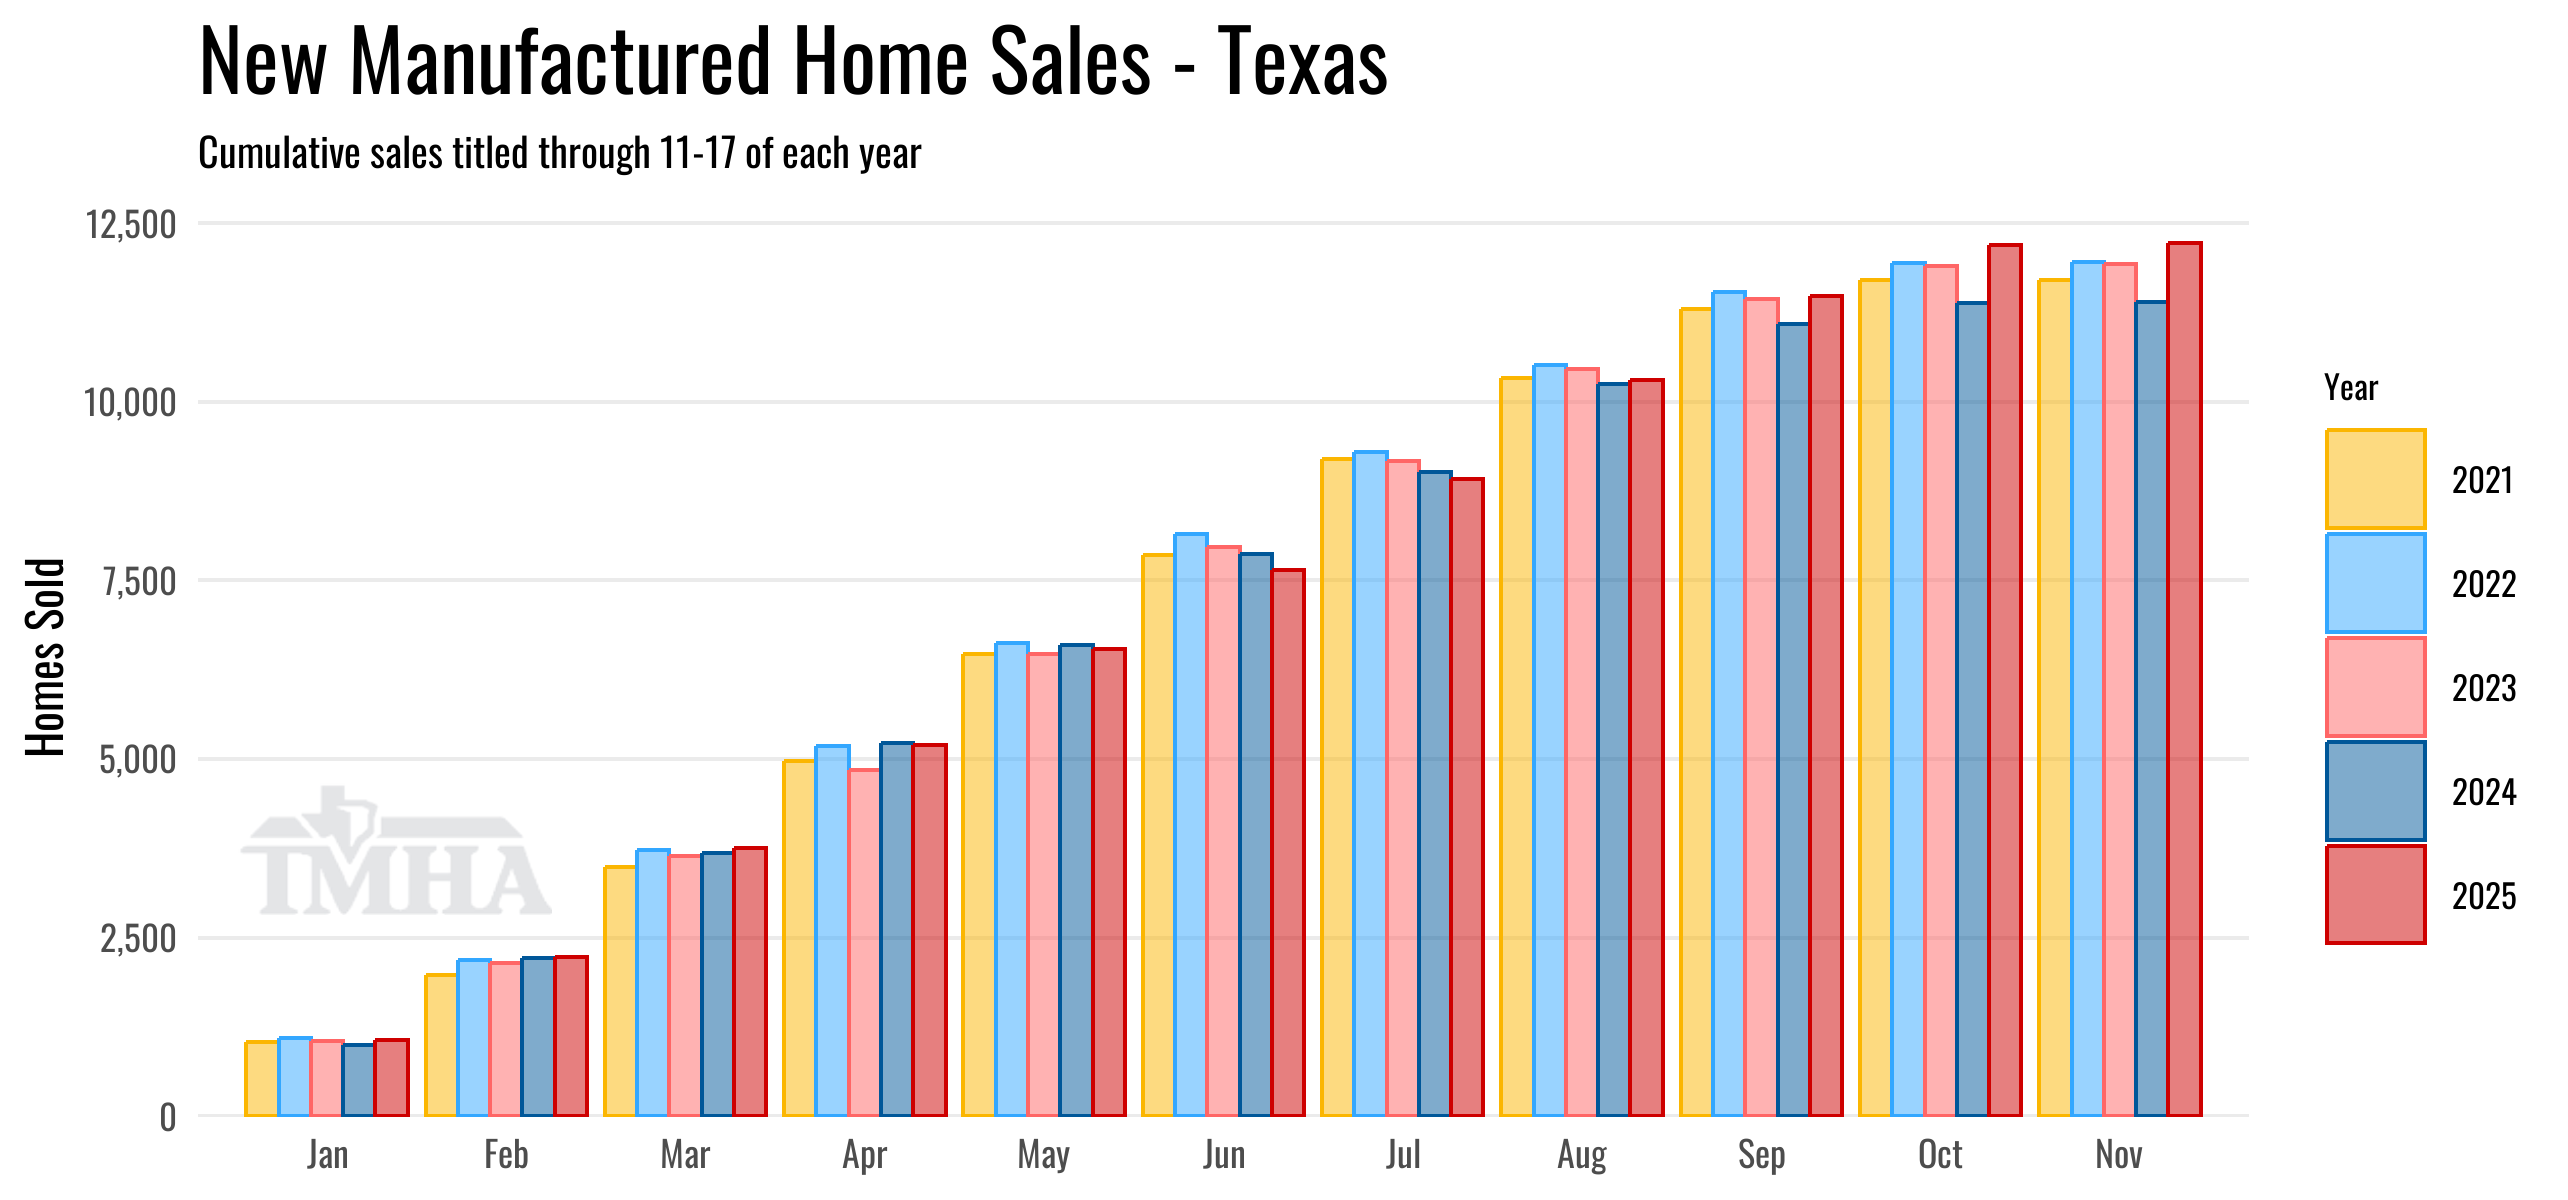
Annual Totals
New home sales for 2025 are now up +7.3% for all retail sales titled through this point in the calendar. Multi-section sales are currently up +13.2% while single-section sale are down -0.3%.
The increased speed in title work submission is likely pushing year-over-year sales up some, but the effects should not be as strong as we’re seeing in the individual month figures as sales that otherwise would have been dated earlier in the year when sales agreements were signed are now coming in with a later sales date of when the transfer of ownership actually occurred.
Install counties with the most additional new home placements over 2024 are Bastrop, Dallas, Caldwell, Tarrant, and McLennan.
Install counties with the biggest decline in new home placements from 2024 are Harris, Fannin, Travis, Brazos, and Carson.
Mailing address cities with the most new home placements over 2024 are Dale, San Antonio, New Braunfels, Burleson, and Crowley.
Mailing address cities with the largest decline in new home placements from 2024 are Houston, Del Valle, Fritch, Kyle, and Huffman.
| New Sales | Singles | Multis | Total |
|---|---|---|---|
| Total for 2025 titled to date: | 5,005 | 7,212 | 12,217 |
| Change from 2024 (%): | -0.3% | 13.2% | 7.3% |
| Change from 2024 (Units): | -16 | 842 | 826 |
| New Home Characteristics for 2025 | Singles | Multis | Total |
|---|---|---|---|
| Median Age of Home (Days): | 124 | 69 | 91 |
| Median Square Footage: | 1,080 | 1,680 | 1,475 |
| Top 10 Counties for New Installs | Total | Change (YoY%) |
|---|---|---|
| Liberty | 476 | 3.3% |
| Montgomery | 434 | -4.6% |
| Harris | 432 | -14.8% |
| Bexar | 381 | 12.7% |
| Bastrop | 340 | 60.4% |
| Ector | 312 | 8.7% |
| Hidalgo | 251 | 8.2% |
| Tarrant | 251 | 26.8% |
| Midland | 250 | 11.6% |
| Smith | 231 | 26.2% |
| Used Sales | Singles | Multis | Total |
|---|---|---|---|
| Total for 2025 titled to date: | 1,771 | 802 | 2,573 |
| Change from 2024 (%): | 21.3% | 17.8% | 20.2% |
| Change from 2024 (Units): | 311 | 121 | 432 |
Charts
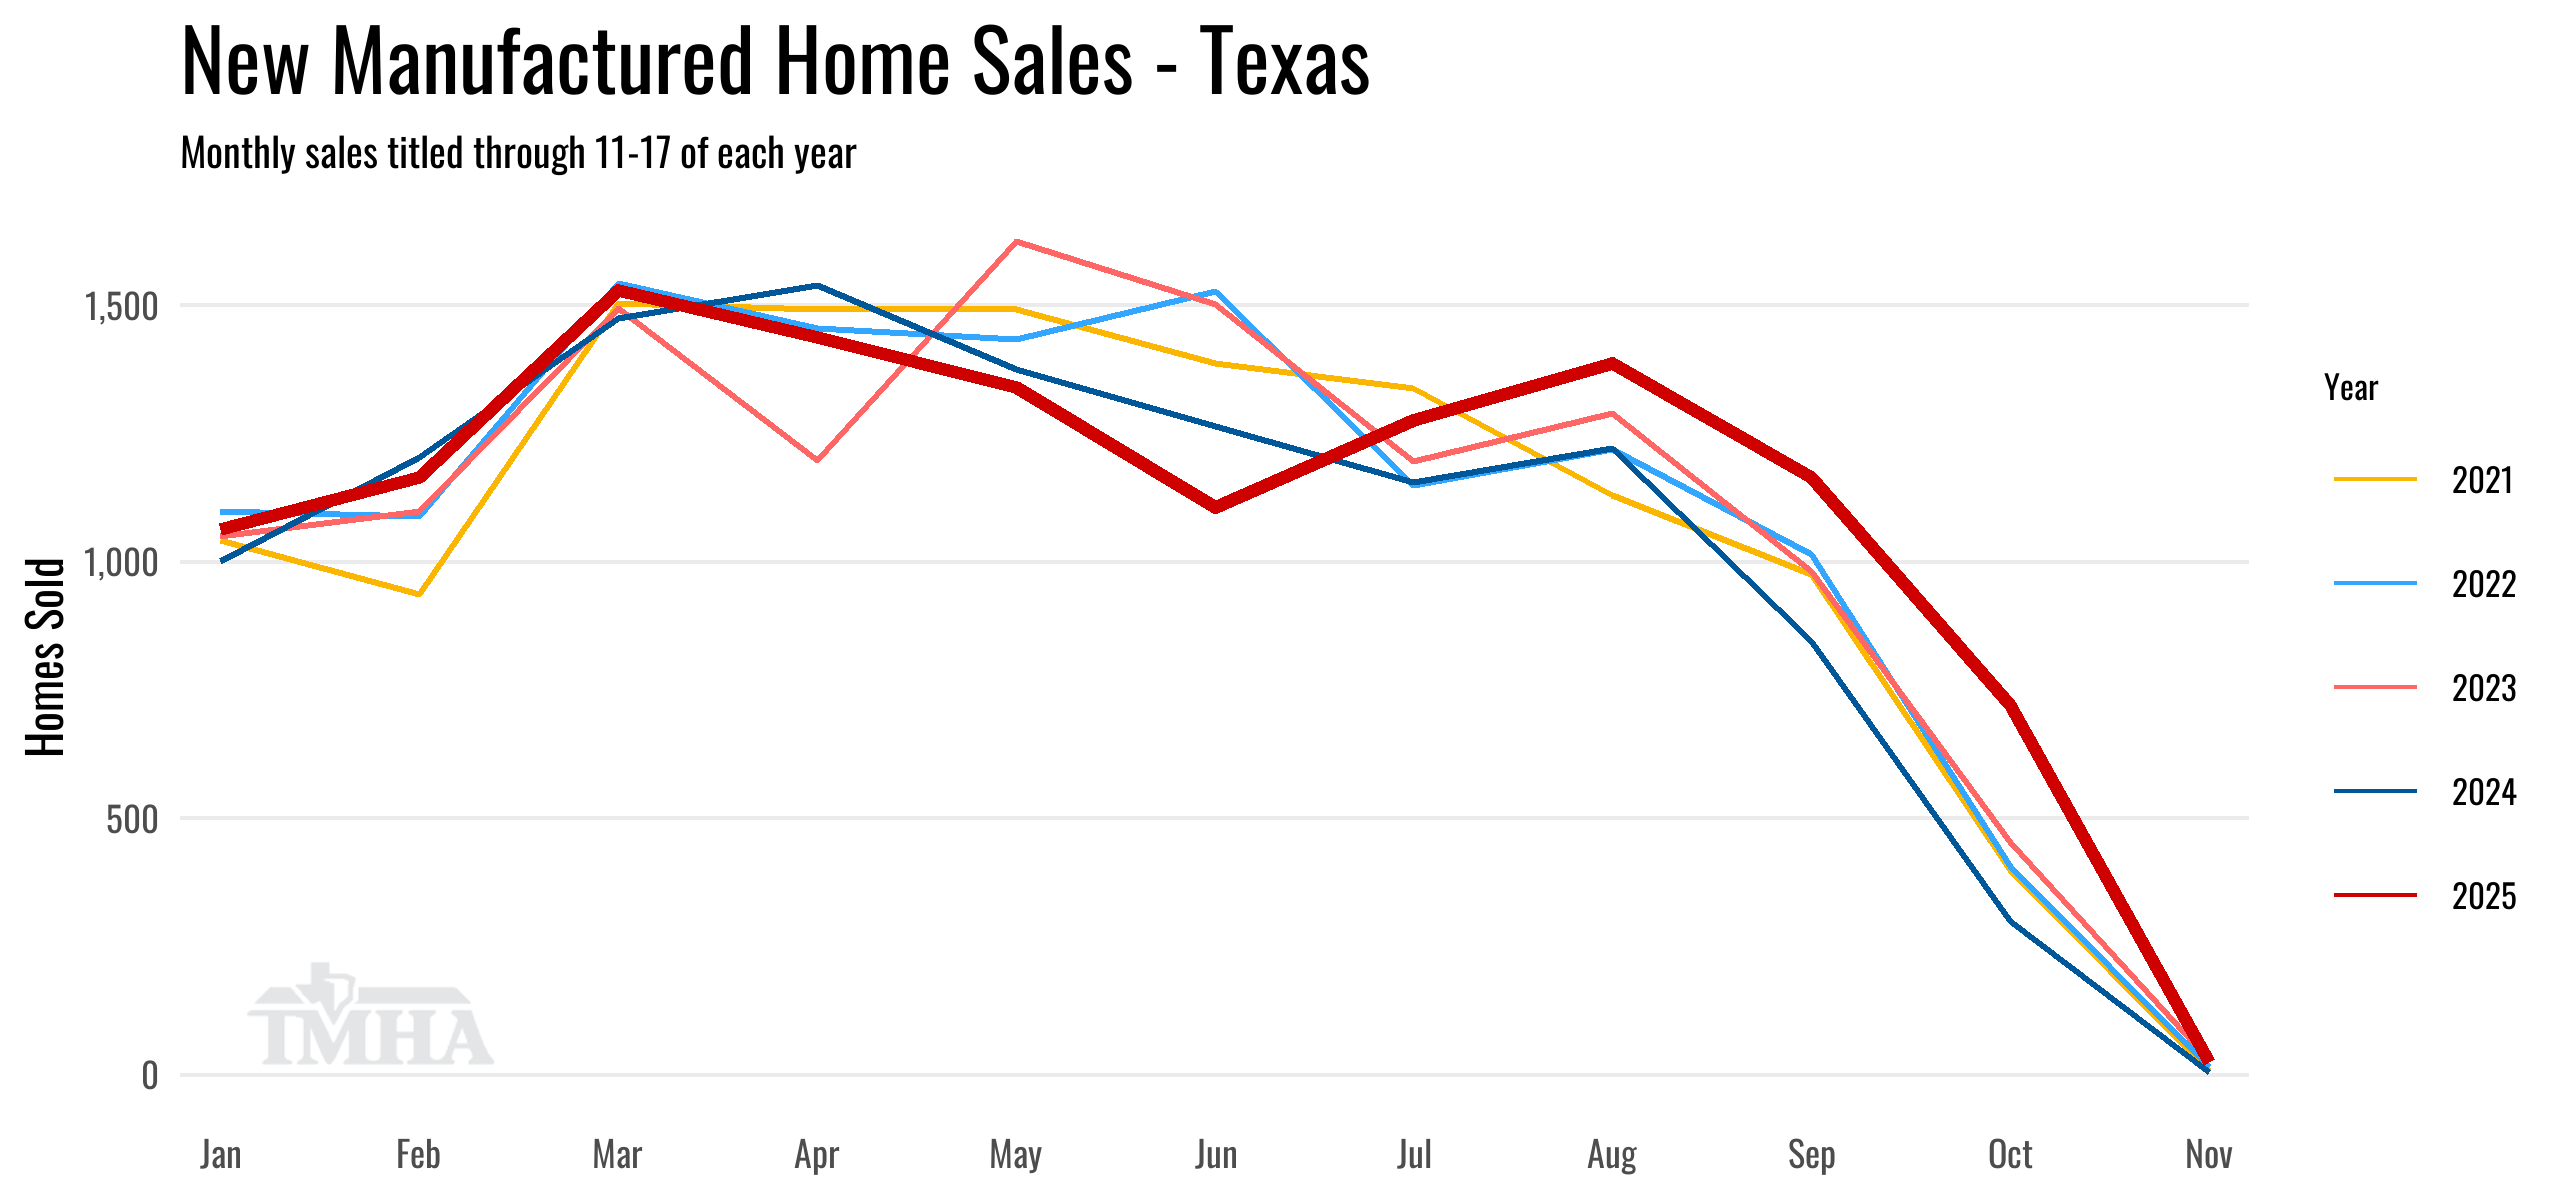
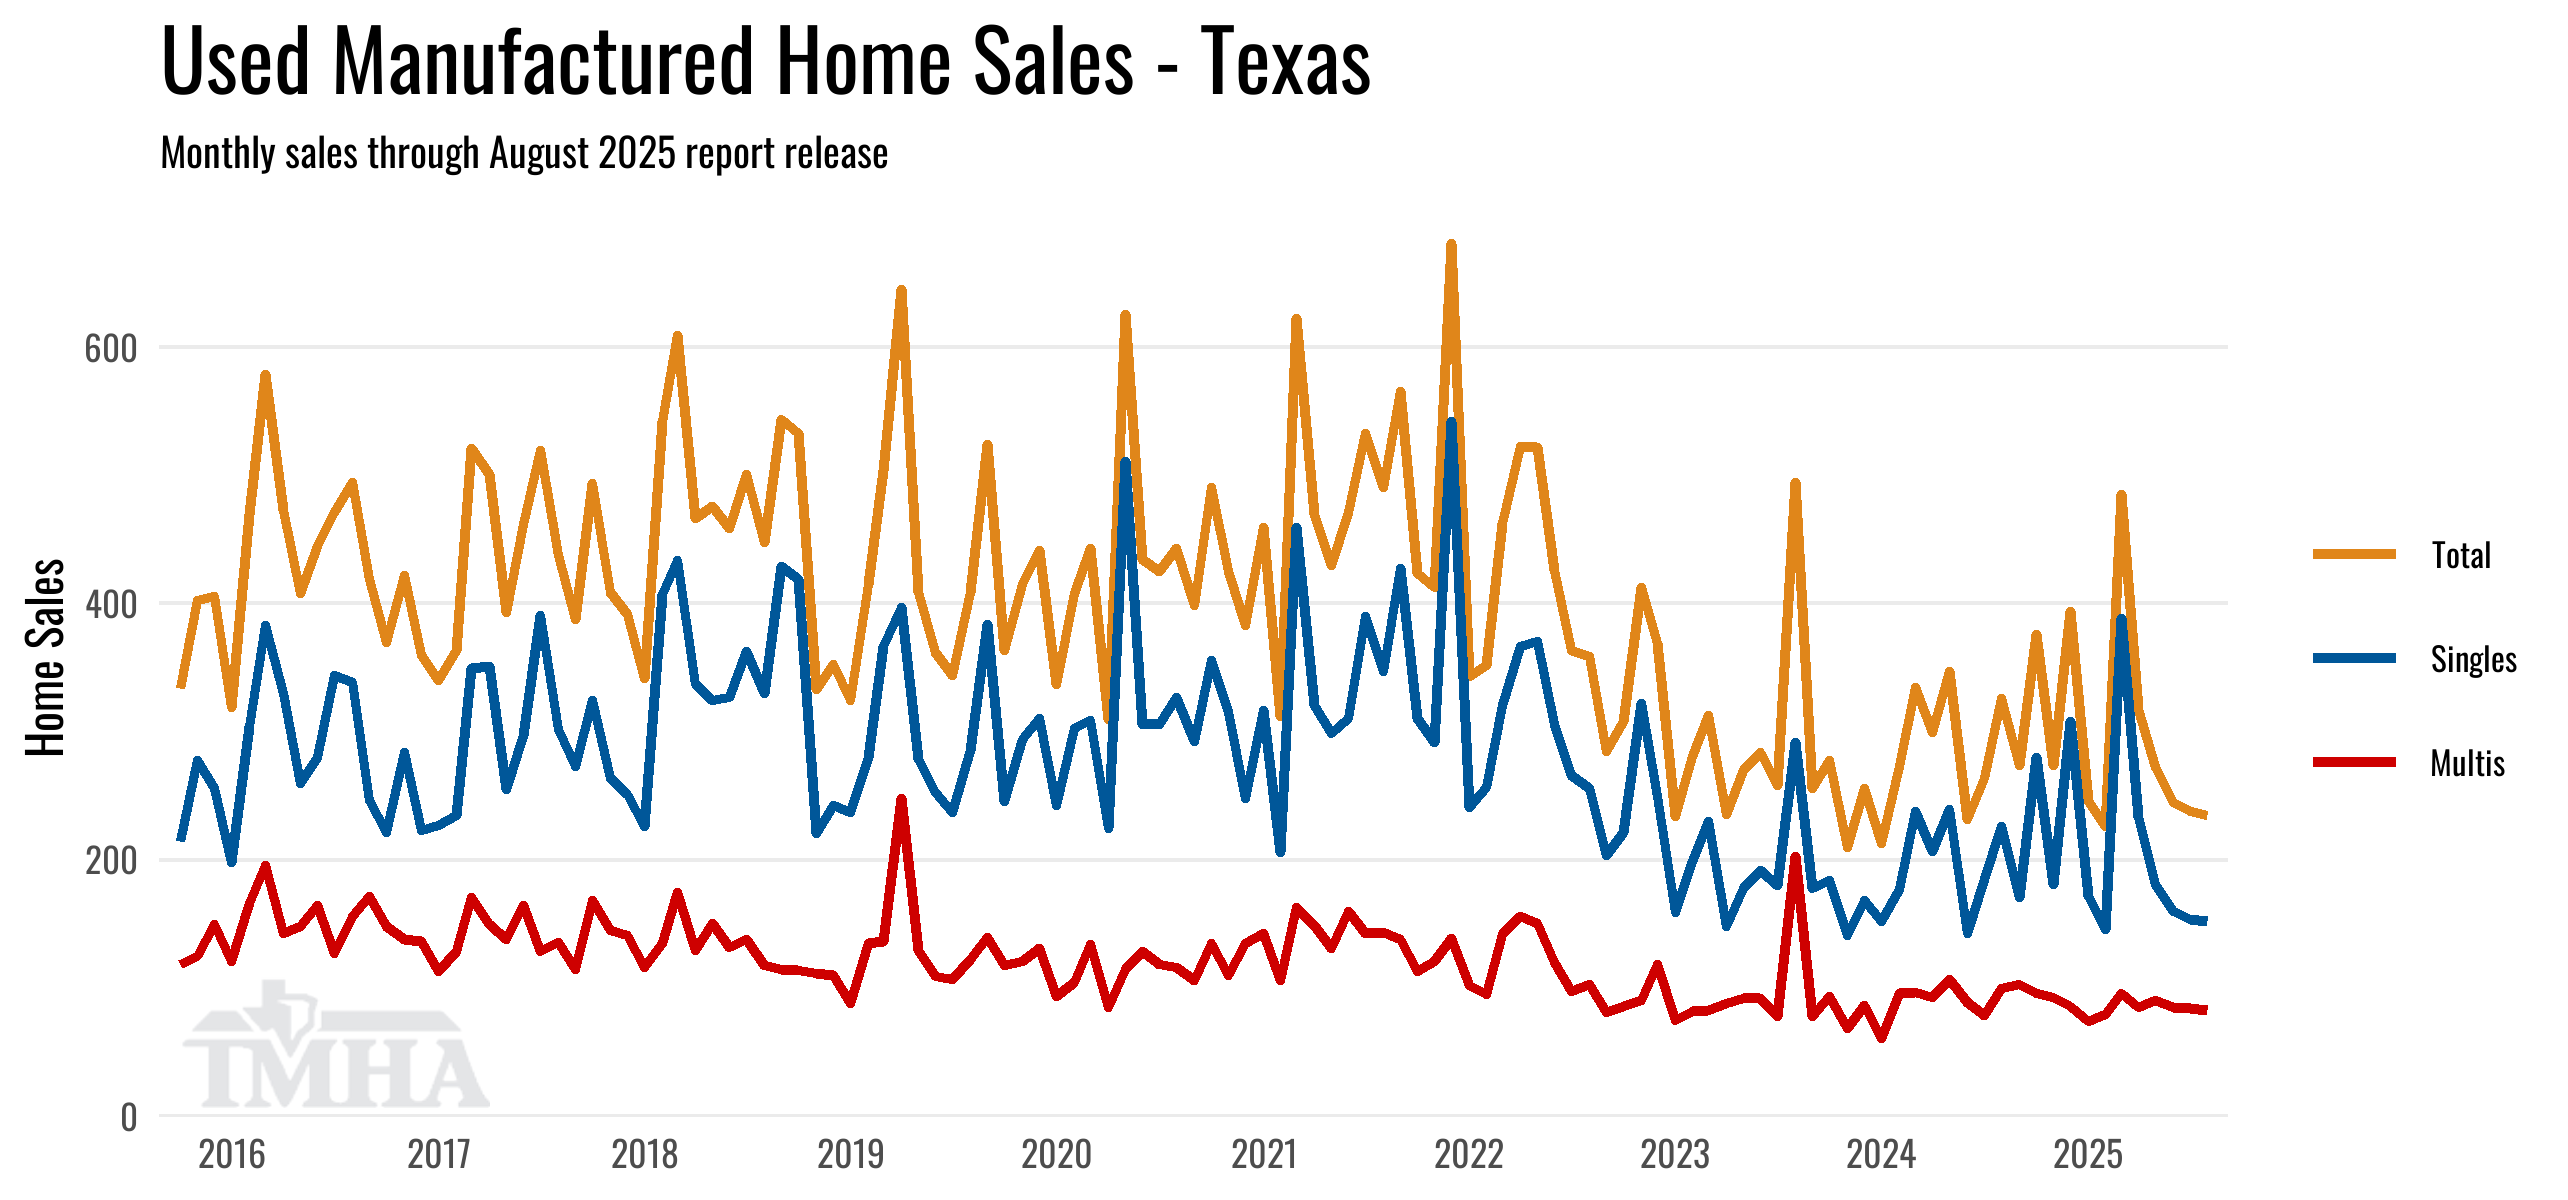
Revised Monthly Totals
Because titles continue to come in for past sales months, here are all prior months for the year and what their current sales totals are at this report release.
| New Sales Month | Singles | Multis | Total | (YoY%) |
|---|---|---|---|---|
| January | 477 | 586 | 1,063 | 6.1 |
| February | 483 | 682 | 1,165 | -3.3 |
| March | 616 | 913 | 1,529 | 3.6 |
| April | 593 | 846 | 1,439 | -6.6 |
| May | 570 | 771 | 1,341 | -2.5 |
| June | 489 | 618 | 1,107 | -12.5 |
| July | 521 | 755 | 1,276 | 10.4 |
| Used Sales Month | Singles | Multis | Total | (YoY%) |
|---|---|---|---|---|
| January | 172 | 74 | 246 | 26.2 |
| February | 146 | 80 | 226 | -11.4 |
| March | 389 | 96 | 485 | 60.6 |
| April | 233 | 85 | 318 | 22.3 |
| May | 181 | 91 | 272 | -1.8 |
| June | 160 | 85 | 245 | 27.6 |
| July | 154 | 84 | 238 | 8.7 |