Texas Manufactured Home Shipments Report October 2025 - Market Analysis & Data
Rob Ripperda
October Shipments
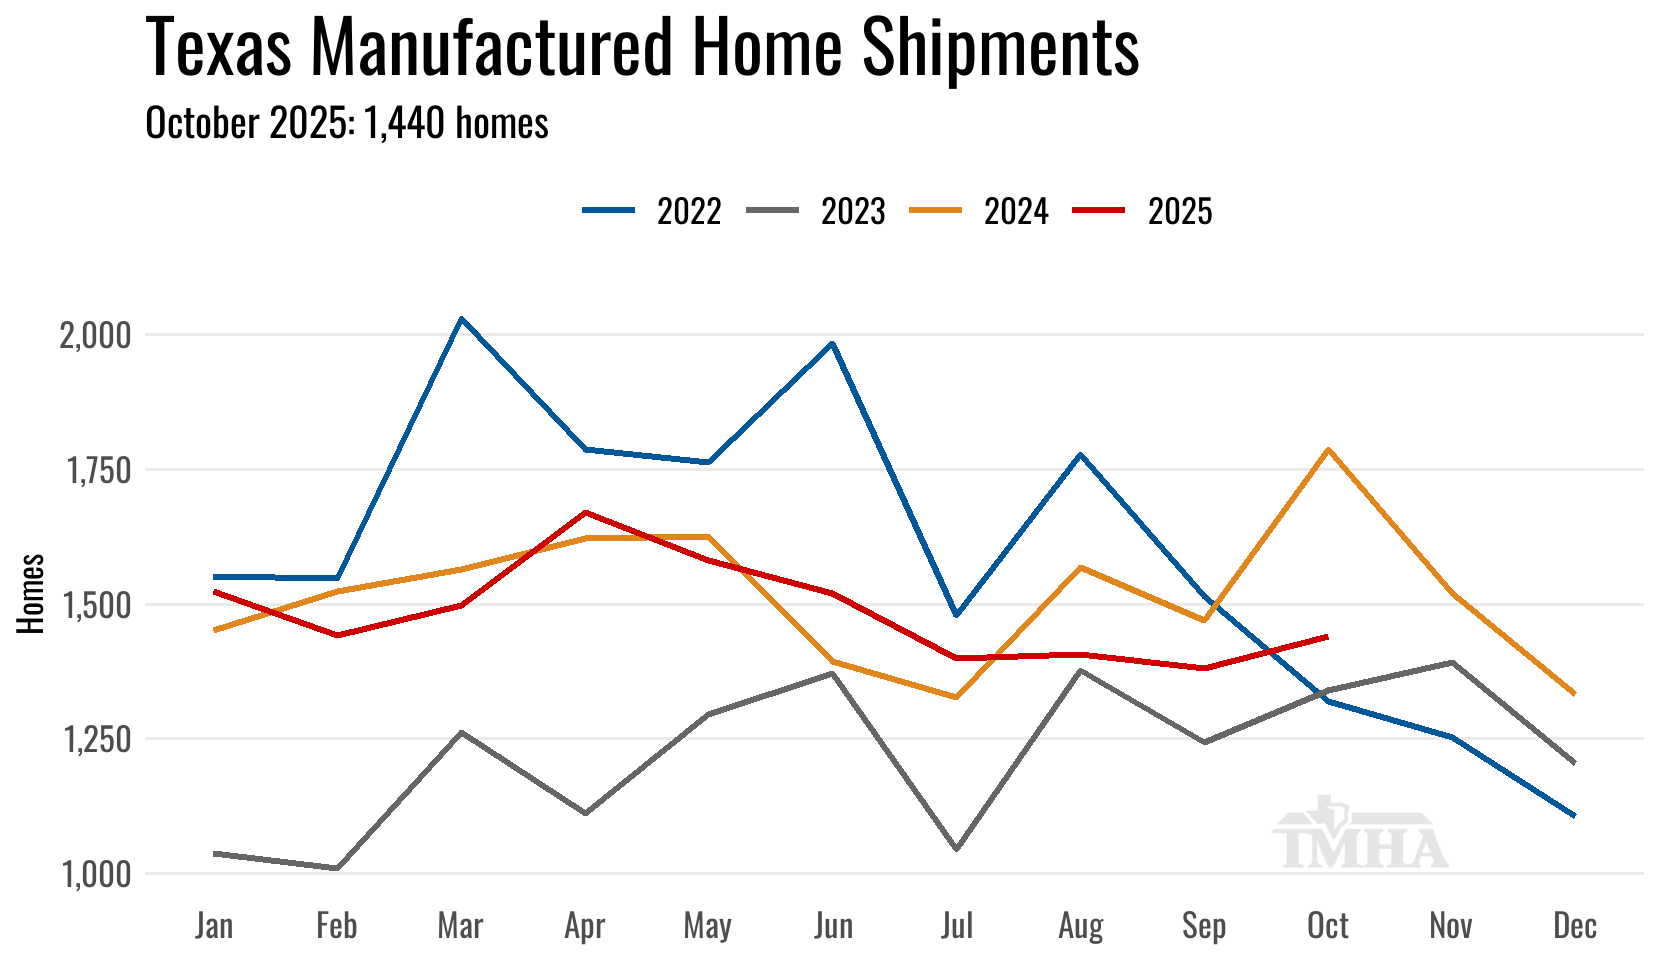
Manufactured home shipments to Texas retailers continued to slow in October for the third straight month moving down a seasonally-adjusted -1.3% from the previous month and down -19.4% on the raw total from October of 2024.
The 1,440 total homes shipped for the month was 70 homes below the point forecast from last month which matched the reported production decline in the Texas Manufactured Housing Survey (TMHS).
| Shipments | Singles | Multis | Total |
|---|---|---|---|
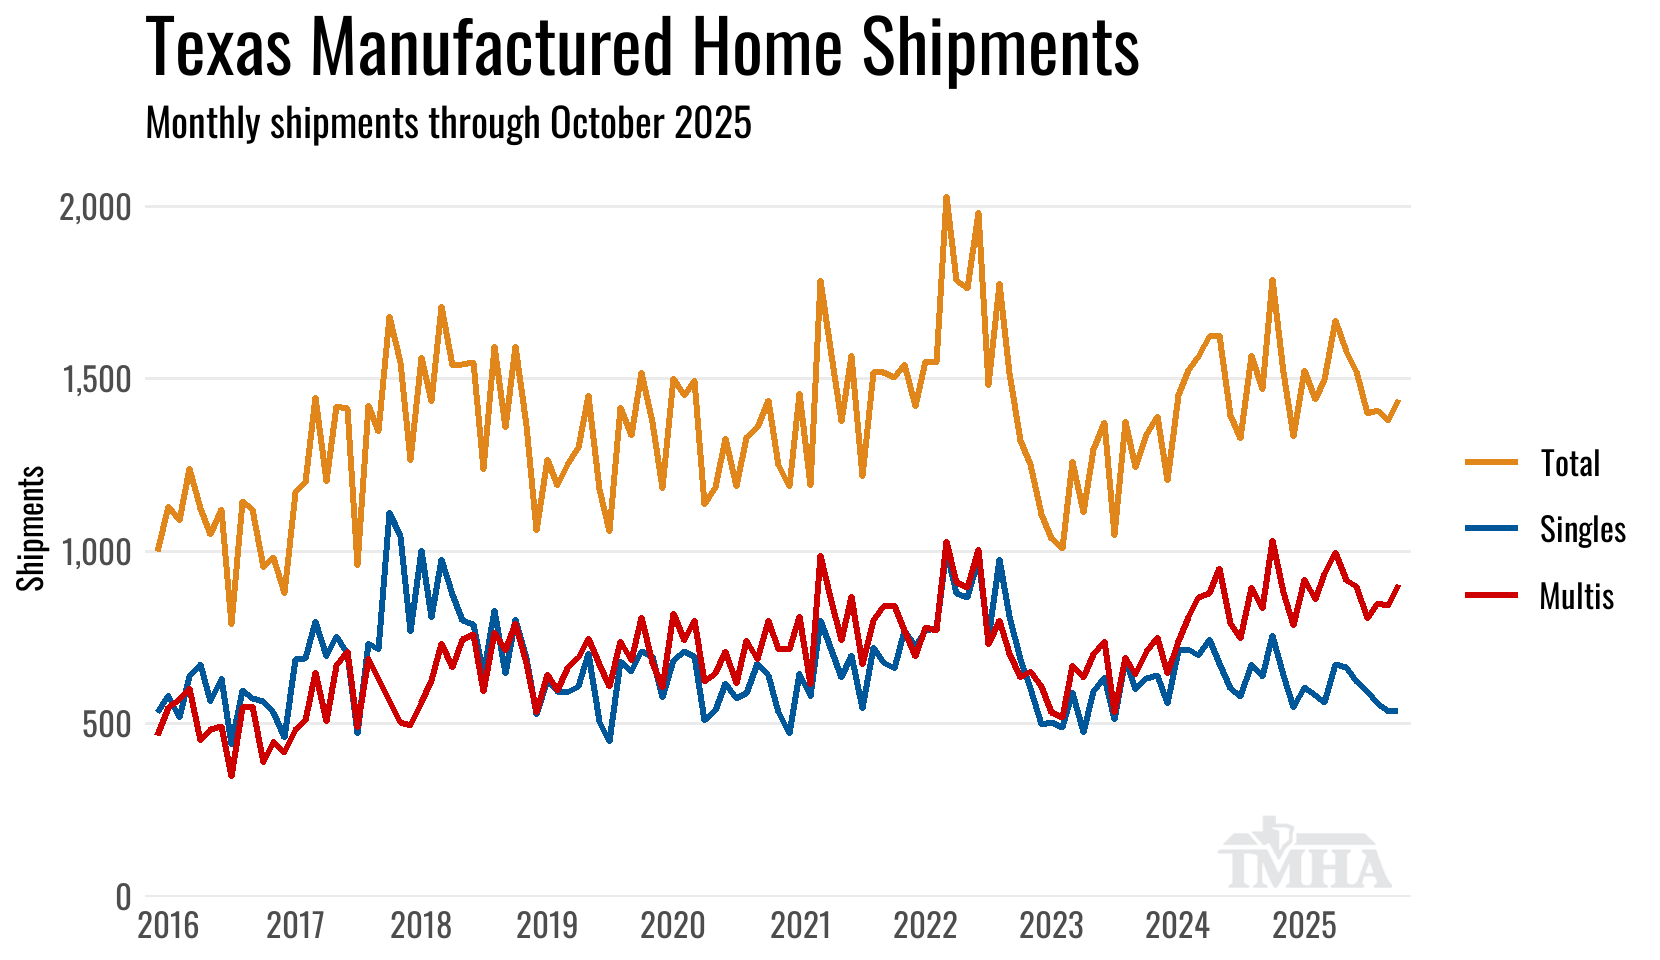
| Total for October: | 537 | 903 | 1,440 |
| Change from September (Raw %): | 0% | 7.1% | 4.3% |
| Change from September (Raw Units): | 0 | 60 | 60 |
| Change from September (SA %): | -3.7% | -2% | -1.3% |
| Change from October of 2024 (%): | -28.9% | -12.5% | -19.4% |
| Change from October of 2024 (Units): | -218 | -129 | -347 |
Monthly Manufacturer Shipments
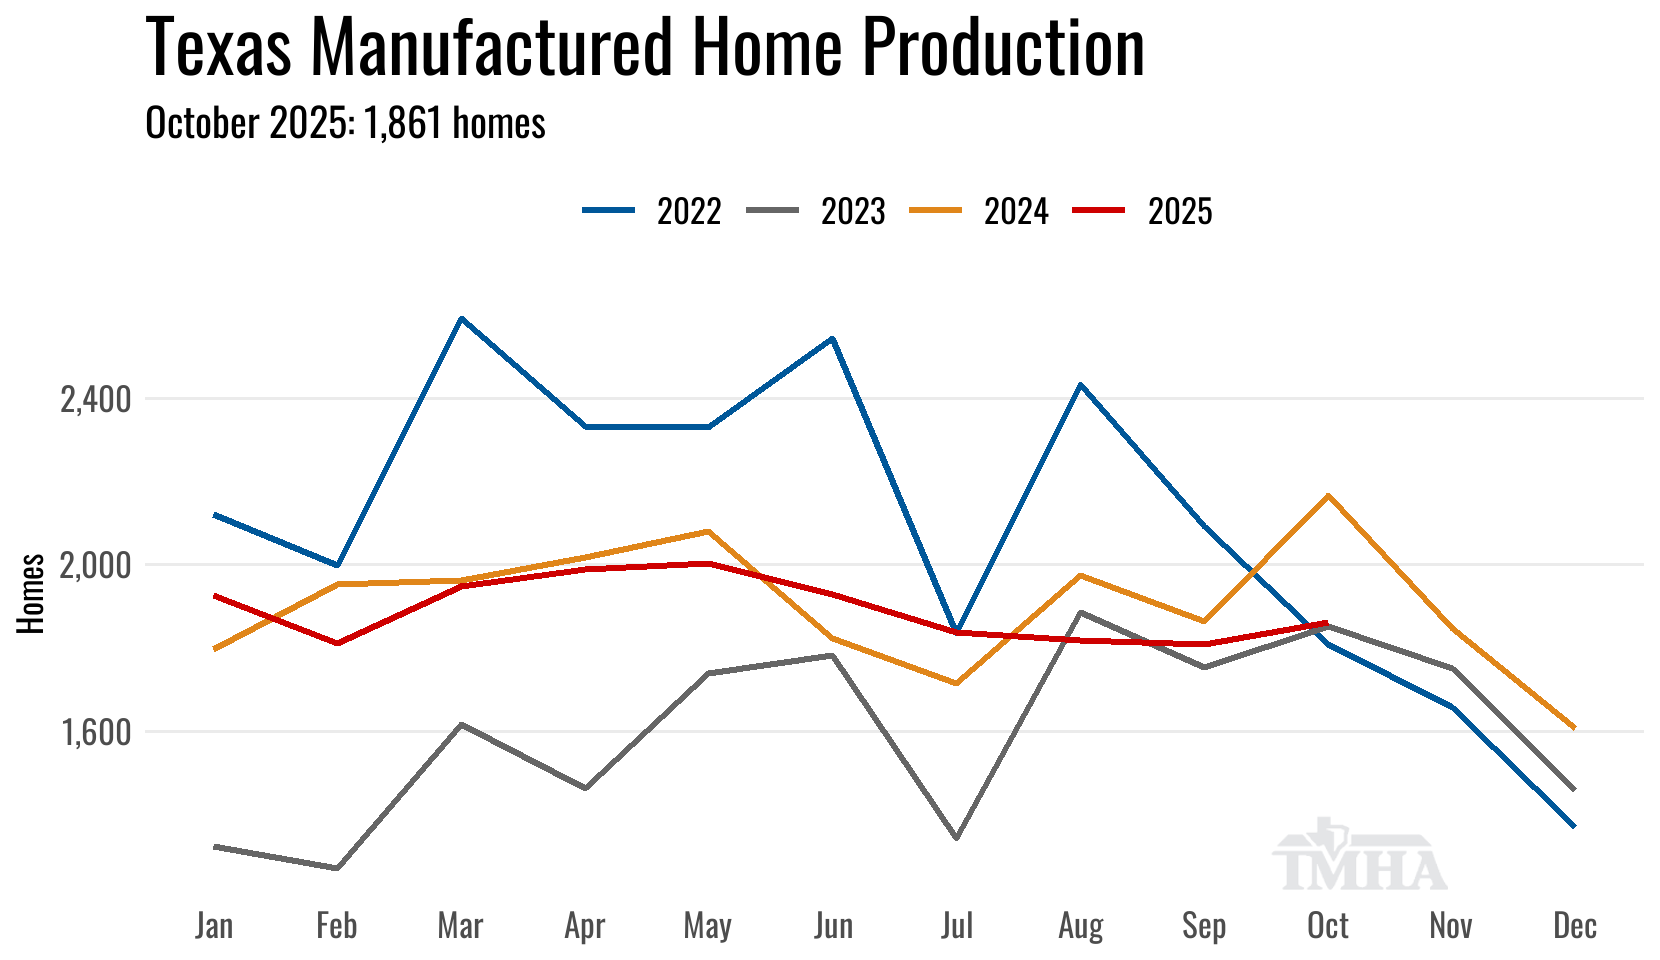
October Production
Texas manufactured housing plant production moved down a seasonally-adjusted -5.9% in October from the previous month in total number of homes produced and down -4.2% when looking at the minimum number of floors that were built.
The 1,861 homes produced was below last month’s point forecast and represented a -14.1% year-over-year decrease from October of 2024. The floor data was also down to 2024 by -13.1%.
The production calendar had the same total number of week days this year as it did last, so this is a definite downshift in output.
| Texas Plant Production | Total | Shipped Out of TX | Min Floors |
|---|---|---|---|
| Total for October: | 1,861 | 497 | 2,697 |
| Change from September (Raw %): | 2.9% | -5.7% | 4.6% |
| Change from September (Raw Units): | 52 | -30 | 118 |
| Change from September (SA %): | -5.9% | NA | -4.2% |
| Change from October of 2024 (%): | -14.1% | -2.5% | -13.1% |
| Change from October of 2024 (Units): | -306 | -13 | -405 |
Monthly Manufacturer Shipments
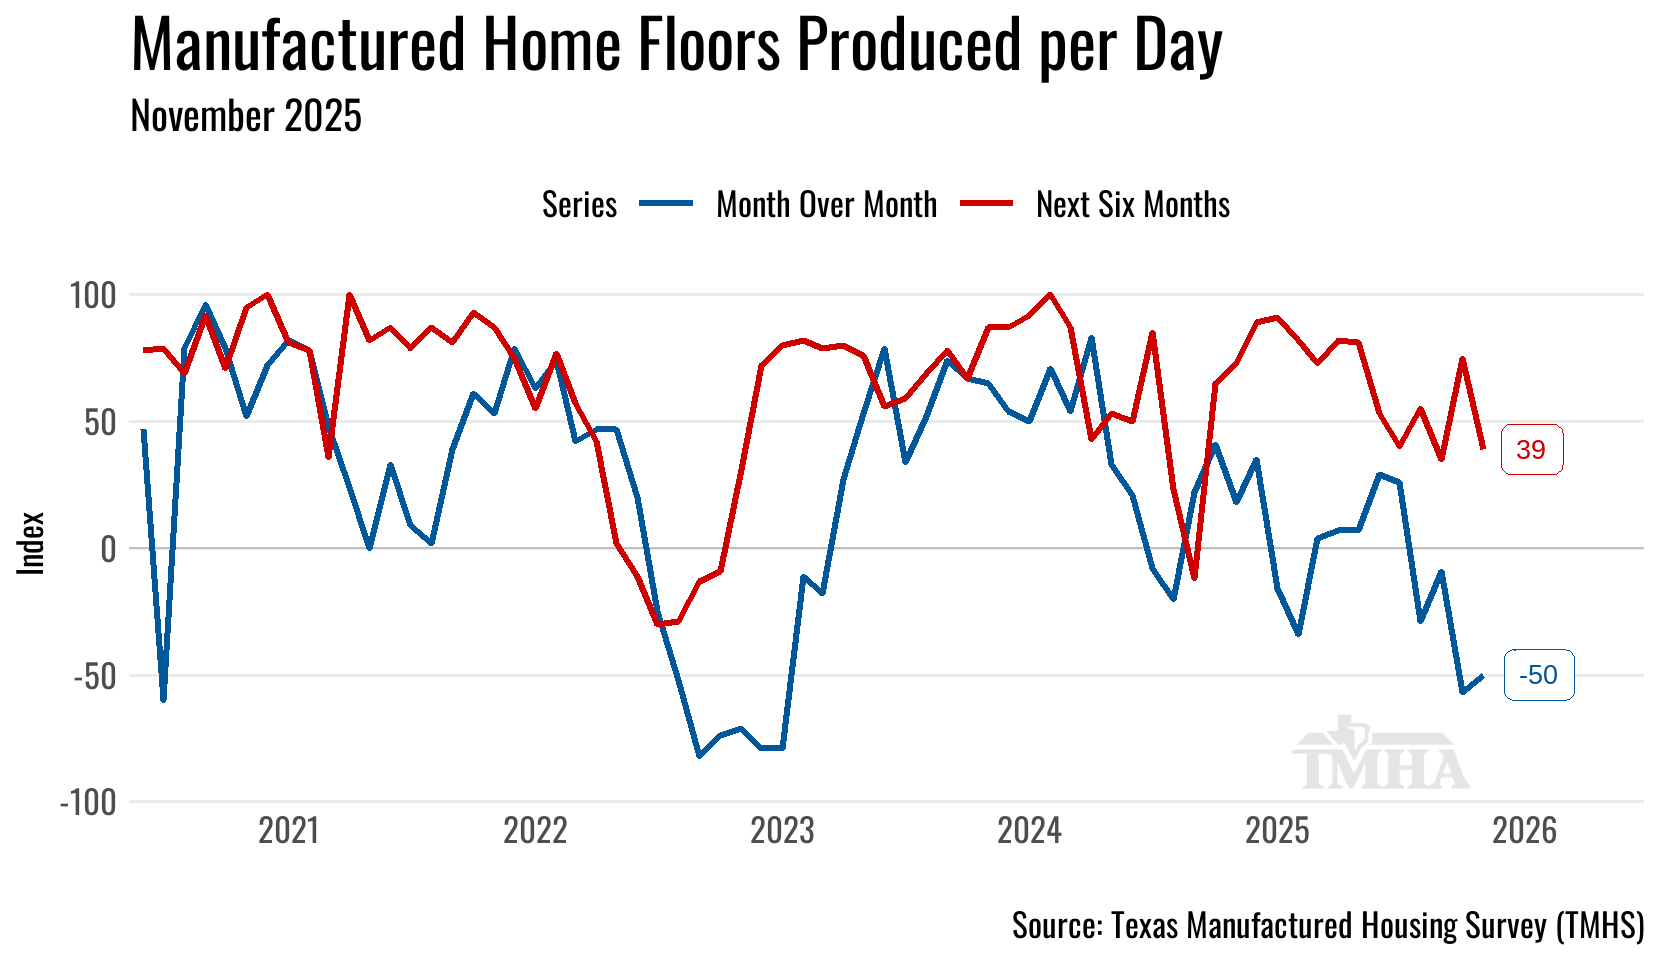
November Outlook
The forecasting models have November shipments at 1,225 (+/- 202) and Texas factory production at 1,478 (+/- 223) homes.
The Texas Manufactured Housing Survey (TMHS) signaled the fourth straight month of lowered run rates in November.
Take the under on both forecasts.
Texas Manufactured Home Survey Results
Year to Date
Shipments
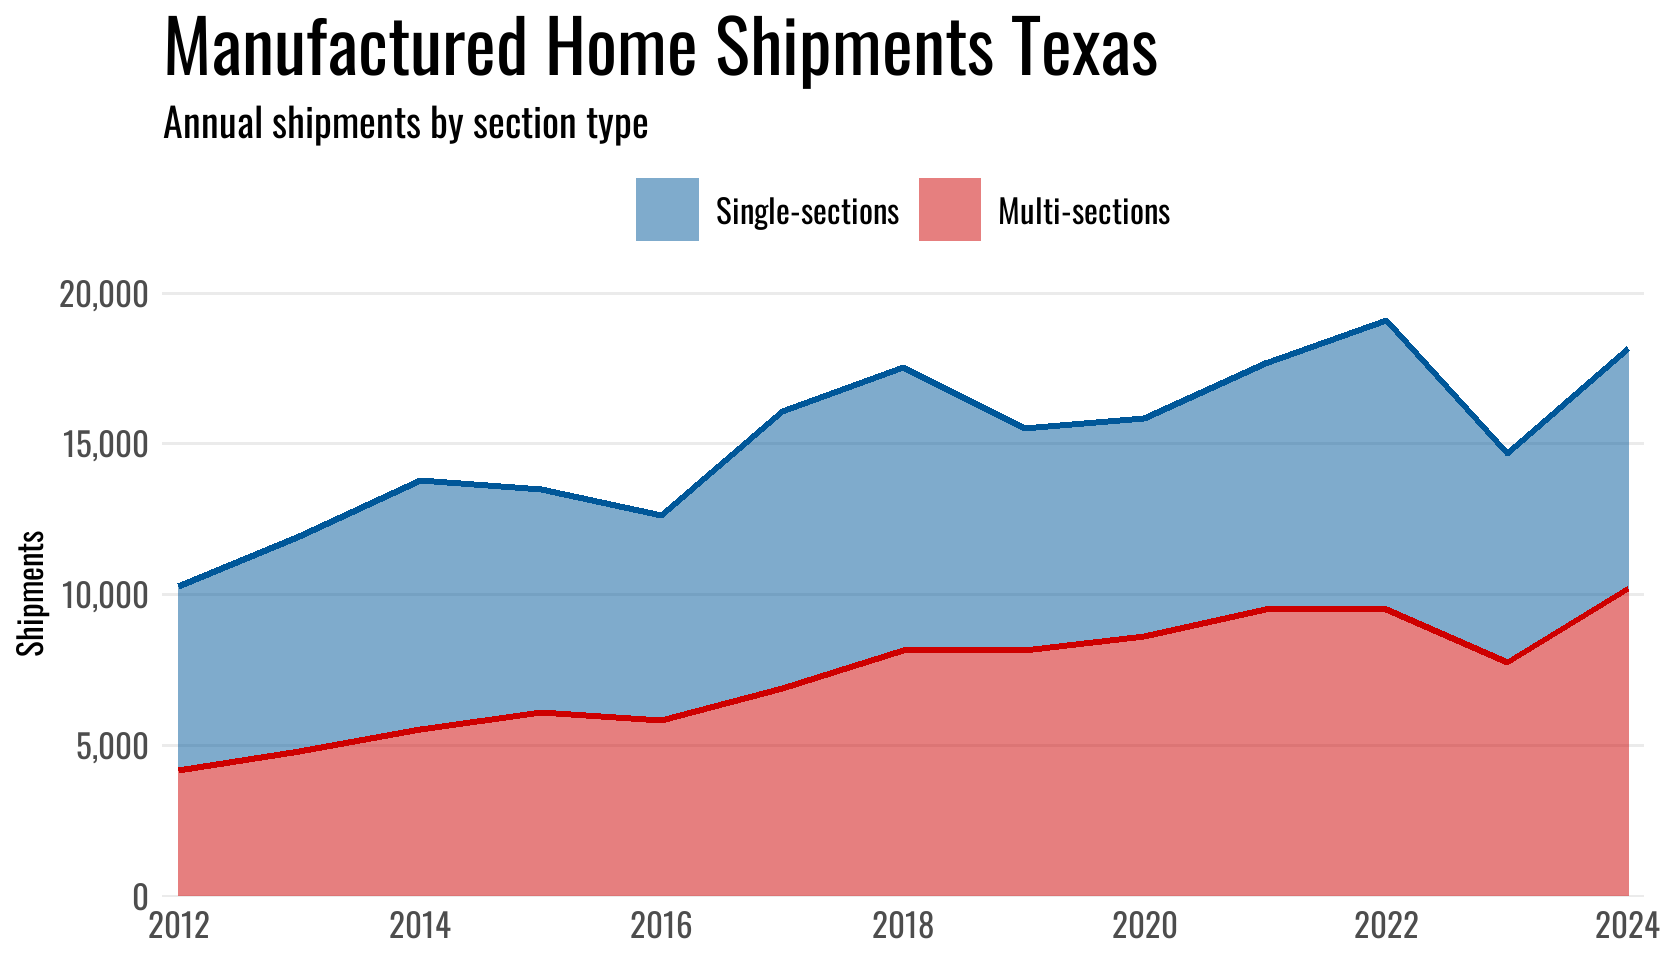
The shipment total for the year has now moved -3.1% below 2024 as an expansion in multi-section units headed to Texas retailers hasn’t been as large as the contraction in single-section shipments across the state.
The forecast for annual Texas shipments in 2025 moved down to 17,389 (+/- 403), that amount would put the year -4% below 2024’s shipment total.

| Shipments | Singles | Multis | Total |
|---|---|---|---|
| Total for 2025 YTD: | 5,938 | 8,921 | 14,859 |
| Change from 2024 (%): | -12.5% | 4.4% | -3.1% |
| Change from 2024 (Units): | -848 | 379 | -469 |
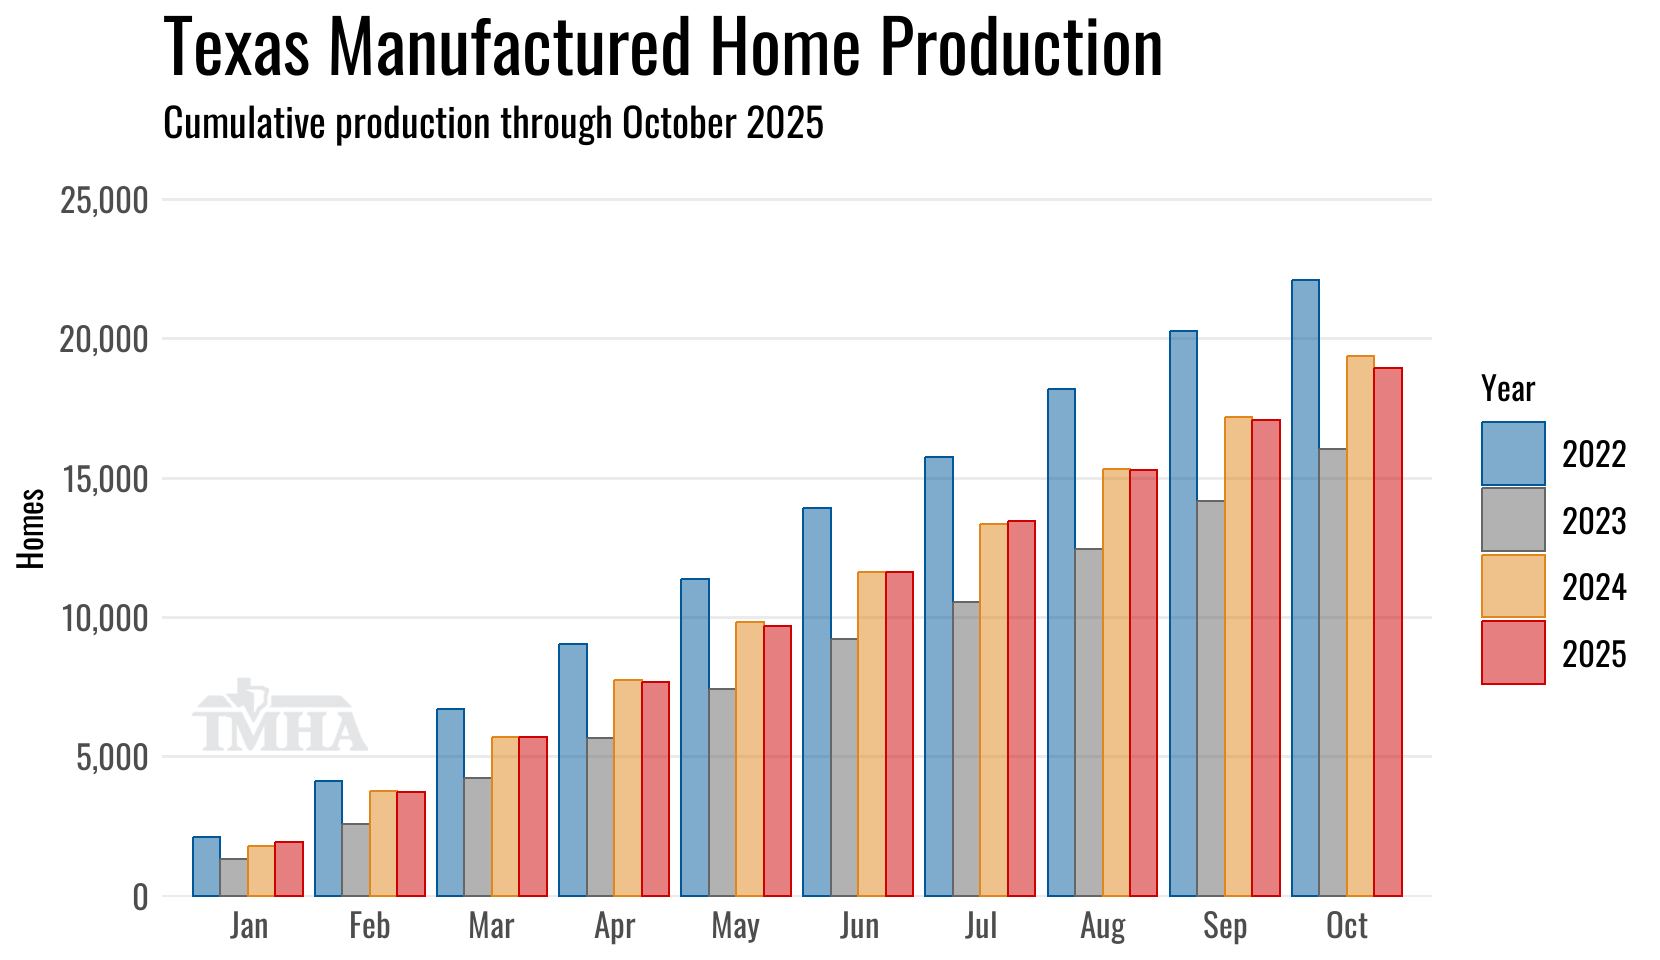
Production
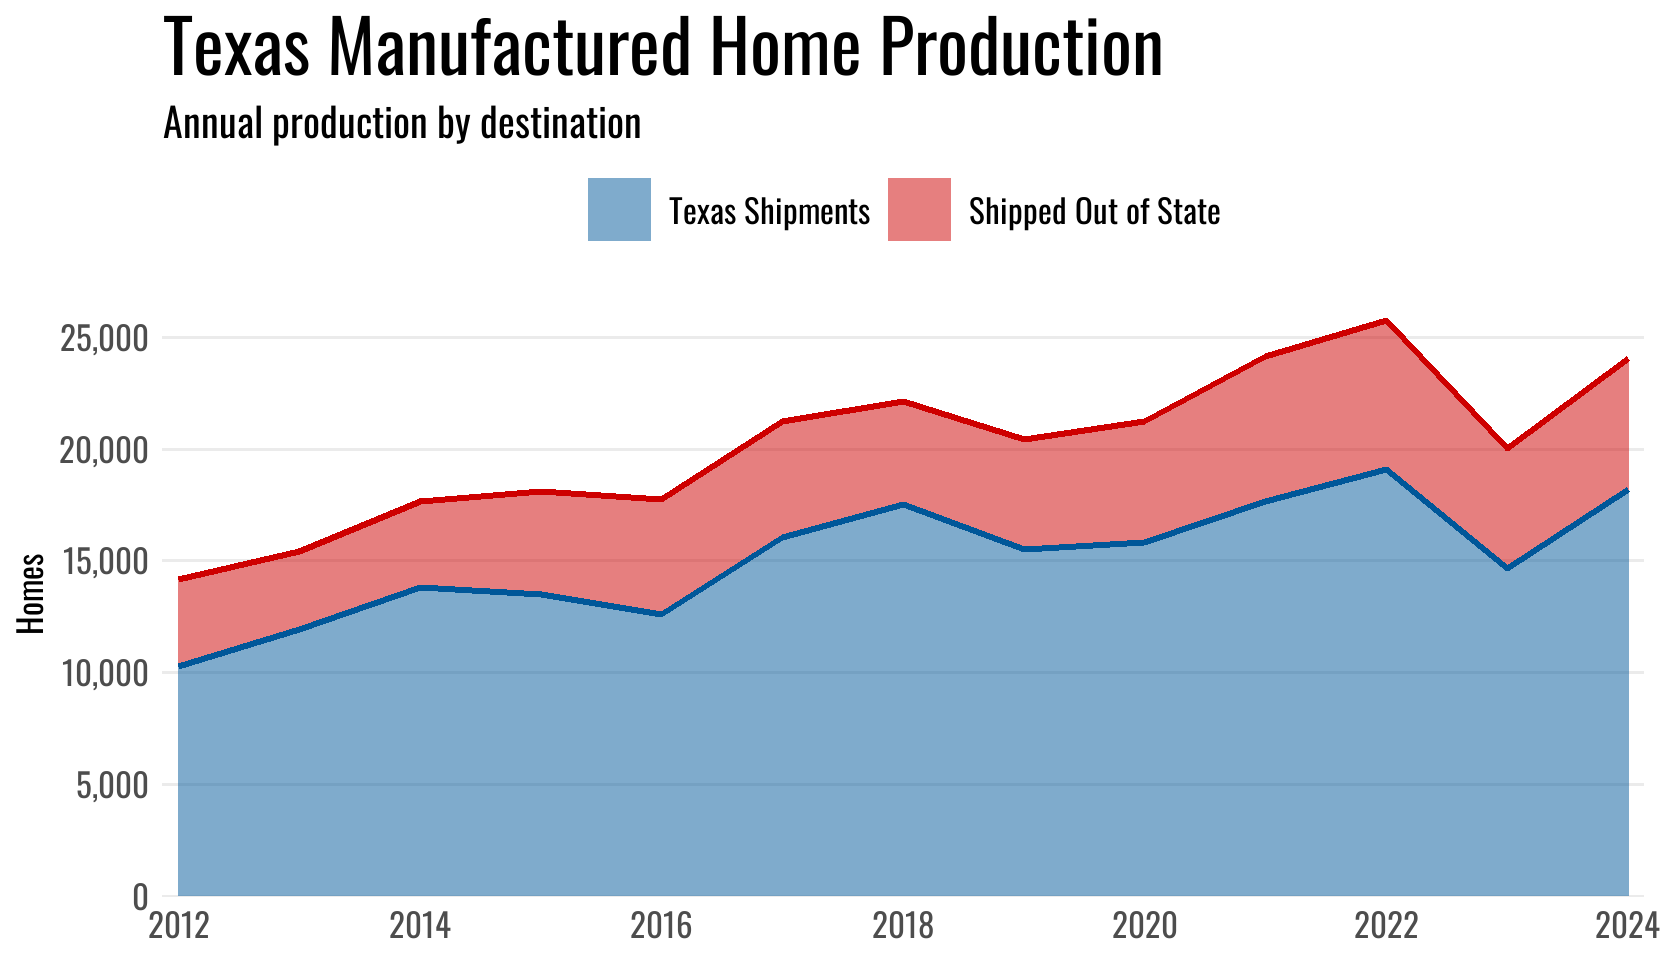
Texas plant total home production moved down -2.1% on the year and the minimum floors built year-over-year flipped negative coming in -0.5% below 2024.
The forecast for annual Texas plant production moved down to 22,151 (+/- 478), predicting a -2.8% decline from the 2024 production total.
| Texas Plant Production | Total | Shipped Out of TX | Min Floors |
|---|---|---|---|
| Total for 2025 YTD: | 18,933 | 5,107 | 27,080 |
| Change from 2024 (%): | -2.1% | 2.3% | -0.5% |
| Change from 2024 (Units): | -416 | 114 | -134 |
Annual Totals