Texas Manufactured Home Shipments Report May 2025 - Market Analysis & Data
Rob Ripperda
May Shipments
Manufactured home shipments to Texas retailers in May moved down a seasonally-adjusted -0.7% from the previous month. The 1,580 total of homes shipped for the month was just three homes above the point forecast but represented a -2.8% decline from May of 2024. Despite the deceleration from Aprils high, the number of homes shipped per day remains elevated over the monthly volumes seen in the first quarter of the year and the decline from May of 2024 is a result of having one less production day in 2025.
Multi-section home shipments continue to outpace single-sections.
| Shipments | Singles | Multis | Total |
|---|---|---|---|
| Total for May: | 664 | 916 | 1,580 |
| Change from April (Raw %): | -1.3% | -8.1% | -5.4% |
| Change from April (Raw Units): | -9 | -81 | -90 |
| Change from April (SA %): | 3.9% | -5.1% | -0.7% |
| Change from May of 2024 (%): | -1.5% | -3.7% | -2.8% |
| Change from May of 2024 (Units): | -10 | -35 | -45 |
Monthly Manufacturer Shipments
May Production
Texas manufactured housing plant production accelerated in May moving up a seasonally-adjusted +3.8% from April as manufacturers saw an increase in out-of-state deliveries while maintaining an elevated shipment rate to Texas retailers compared to the first quarter of the year.
The 2,002 homes produced was above the point forecast for the month but was down -3.7% on May of 2024 due to one less day of production.
The run rates for both total homes and floors moved up to their highest levels on the year.
| Texas Plant Production | Total | Shipped Out of TX | Min Floors |
|---|---|---|---|
| Total for May: | 2,002 | 531 | 2,838 |
| Change from April (Raw %): | 0.7% | 13% | -1.3% |
| Change from April (Raw Units): | 13 | 61 | -37 |
| Change from April (SA %): | 3.8% | NA | 2% |
| Change from May of 2024 (%): | -3.7% | -9.2% | -3% |
| Change from May of 2024 (Units): | -77 | -54 | -87 |
Monthly Manufacturer Shipments
June Outlook
The forecasting models have June shipments at 1,555 (+/- 217) and Texas factory production at 1,967 (+/- 224) homes.
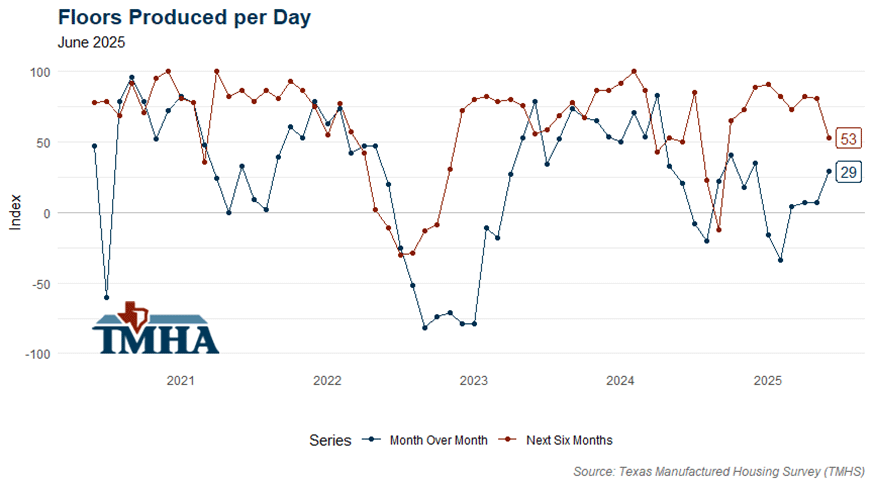
The Texas Manufactured Housing Survey (TMHS) for June has run rates moving higher for the month, so there’s a slight lean towards the over on both shipments and production.
Texas Manufactured Home Survey Results
Annual Totals
The shipment total for the year is currently -0.9% below 2024 while Texas plant production is down -1.3% for total homes but is up +1.6% for number of floors as multi-section deliveries remain strong.
The forecast for annual Texas shipments in 2025 moved down to 18,149 (+/- 1,834) and forecasted Texas plant production moved down to 22,943 (+/- 2,149).
| Shipments | Singles | Multis | Total |
|---|---|---|---|
| Total for 2025 YTD: | 3,088 | 4,624 | 7,712 |
| Change from 2024 (%): | -12.8% | 9% | -0.9% |
| Change from 2024 (Units): | -453 | 381 | -72 |
| Texas Plant Production | Total | Shipped Out of TX | Min Floors |
|---|---|---|---|
| Total for 2025 YTD: | 9,678 | 2,520 | 13,903 |
| Change from 2024 (%): | -1.3% | -1.6% | 1.6% |
| Change from 2024 (Units): | -131 | -40 | 220 |
Charts
January 2025 appears to be the 12-month moving average peak for shipments this production cycle.