Texas Manufactured Home Shipments Report November 2025 - Market Analysis & Data
Rob Ripperda
November Shipments
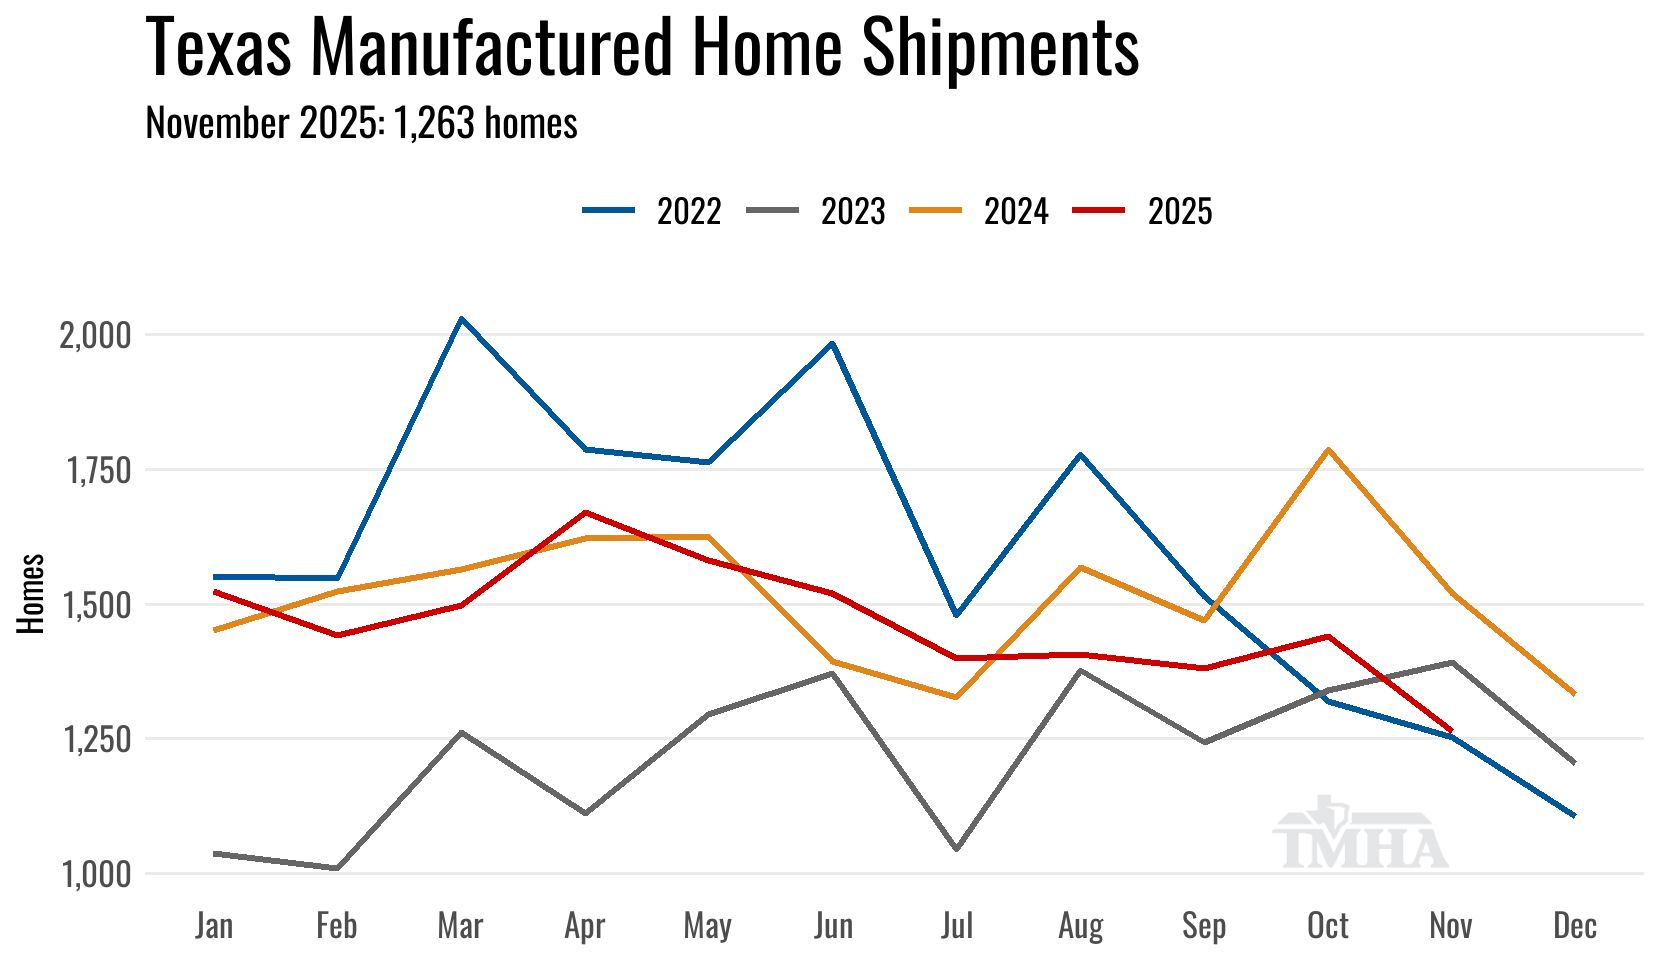
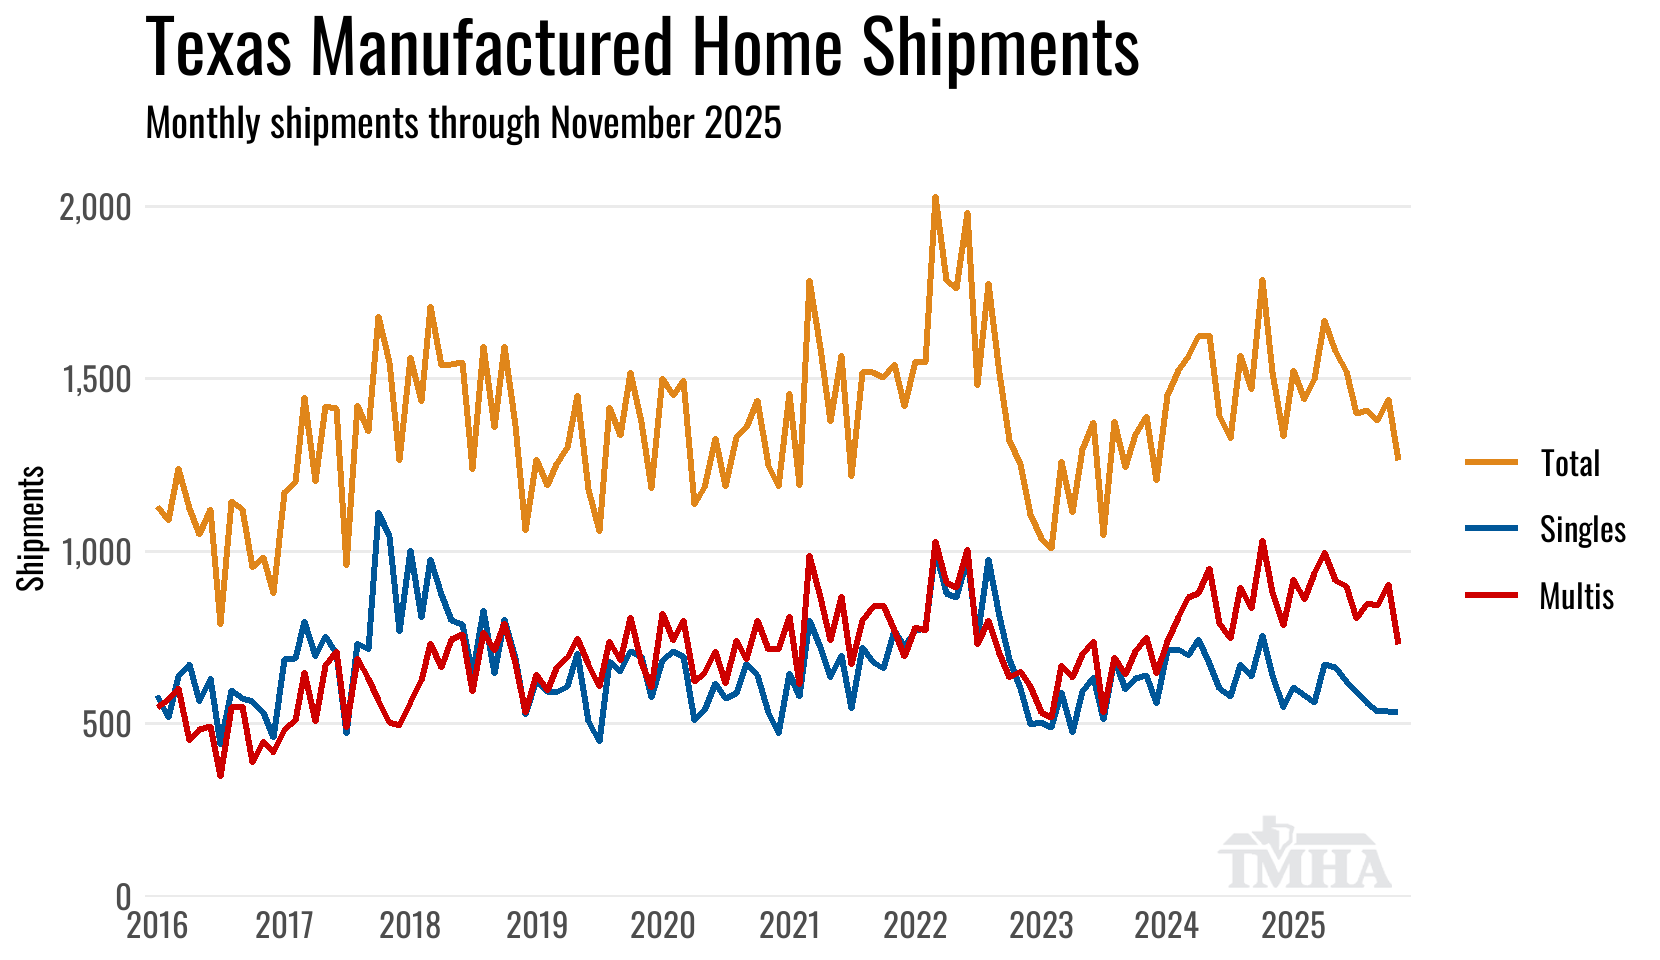
Manufactured home shipments to Texas retailers moved up 2.4% in November on a seasonally-adjusted basis from last month’s low mark on the year with gains coming from a product mix shift towards more single-section homes. Despite the sequential improvement shipments were 16.9% below November of 2024.
The 1,263 total homes shipped for the month was 38 homes above the point forecast from last month, so the rate of deliveries to Texas retailers was better than what the Texas Manufactured Housing Survey (TMHS) indicated but the production schedule for November likely had variability from plant to plant.
| Shipments | Singles | Multis | Total |
|---|---|---|---|
| Total for November: | 534 | 729 | 1,263 |
| Change from October (Raw %): | -0.6% | -19.3% | -12.3% |
| Change from October (Raw Units): | -3 | -174 | -177 |
| Change from October (SA %): | 17.8% | -4% | 2.4% |
| Change from November of 2024 (%): | -16.4% | -17.2% | -16.9% |
| Change from November of 2024 (Units): | -105 | -151 | -256 |
Monthly Manufacturer Shipments
November Production
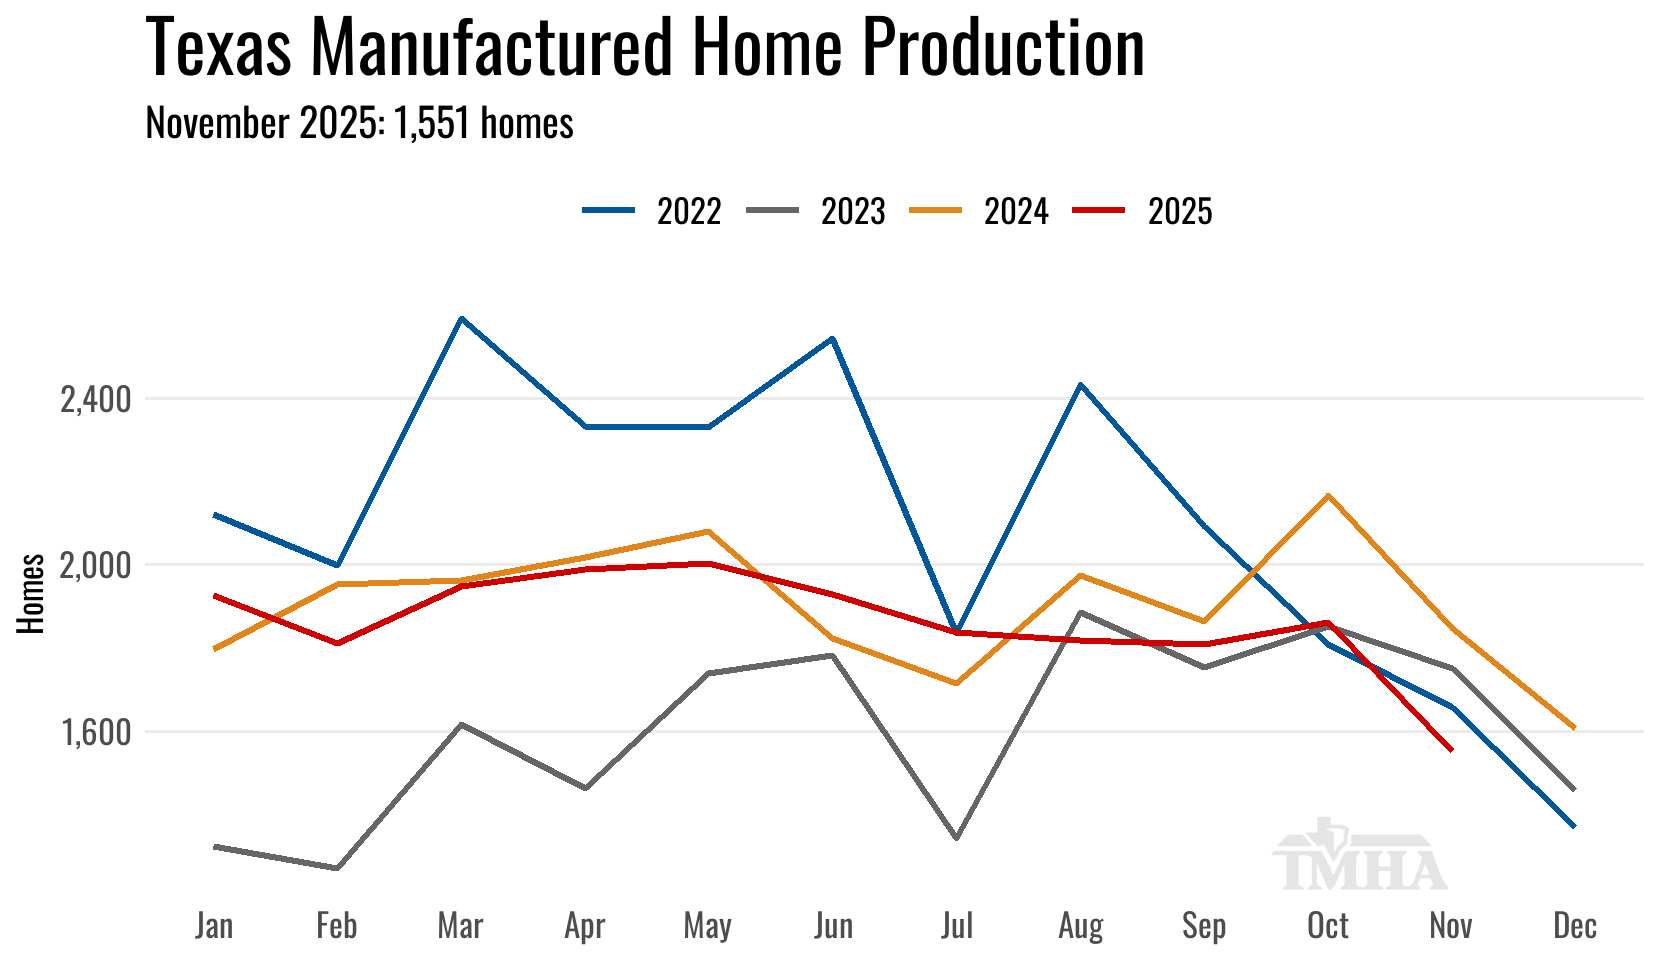
Texas manufactured housing plant production also moved up in November on a seasonally-adjusted basis rising 5.6% over the previous month but again this has more to do with how seasonally low October’s production totals were. The seasonally-adjusted November total is the second lowest it has been on the year, with October being the sole month it was higher than. The total of homes and floors produced were both down 16% from November of 2024 and the 1,551 homes was the lowest total since 2016.
| Texas Plant Production | Total | Shipped Out of TX | Min Floors |
|---|---|---|---|
| Total for November: | 1,551 | 356 | 2,235 |
| Change from October (Raw %): | -16.7% | -28.4% | -17.1% |
| Change from October (Raw Units): | -310 | -141 | -462 |
| Change from October (SA %): | 5.6% | NA | 2.9% |
| Change from November of 2024 (%): | -16.1% | -19.5% | -16% |
| Change from November of 2024 (Units): | -297 | -86 | -425 |
Monthly Manufacturer Shipments
December Outlook
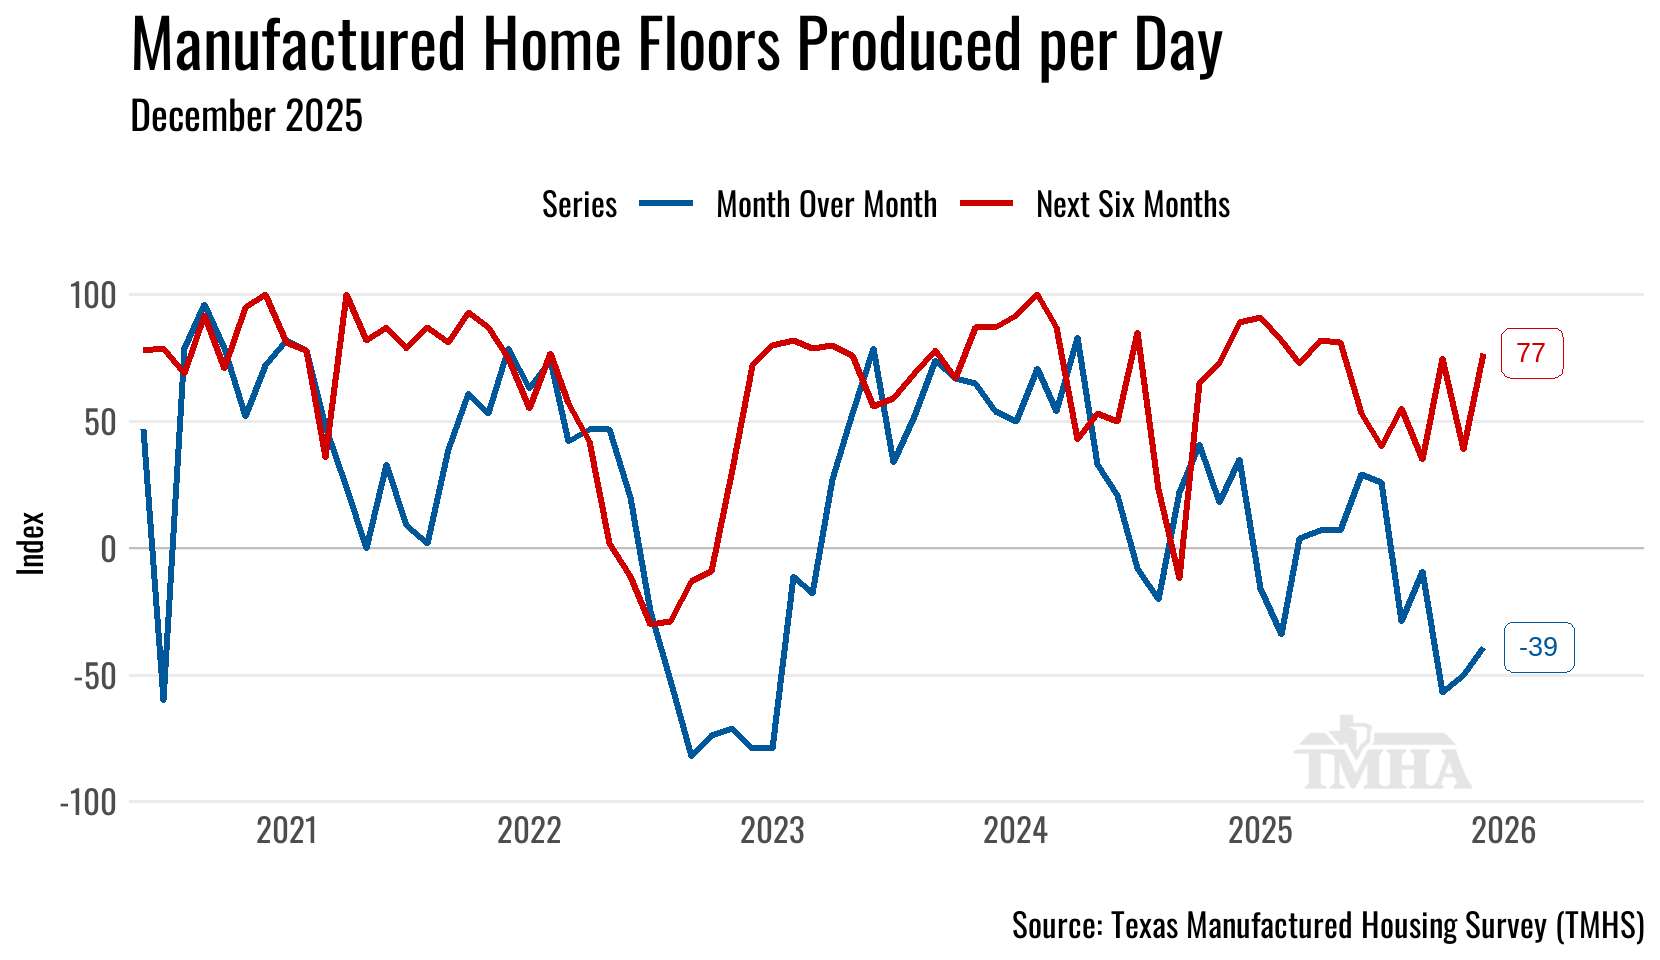
The forecasting models have December shipments at 1,211 (+/- 191) and Texas factory production at 1,517 (+/- 222) homes.
The Texas Manufactured Housing Survey (TMHS) signaled the fifth straight month of lowered run rates in December.
Take the under on both forecasts.
Texas Manufactured Home Survey Results
Retail Sales Comparison
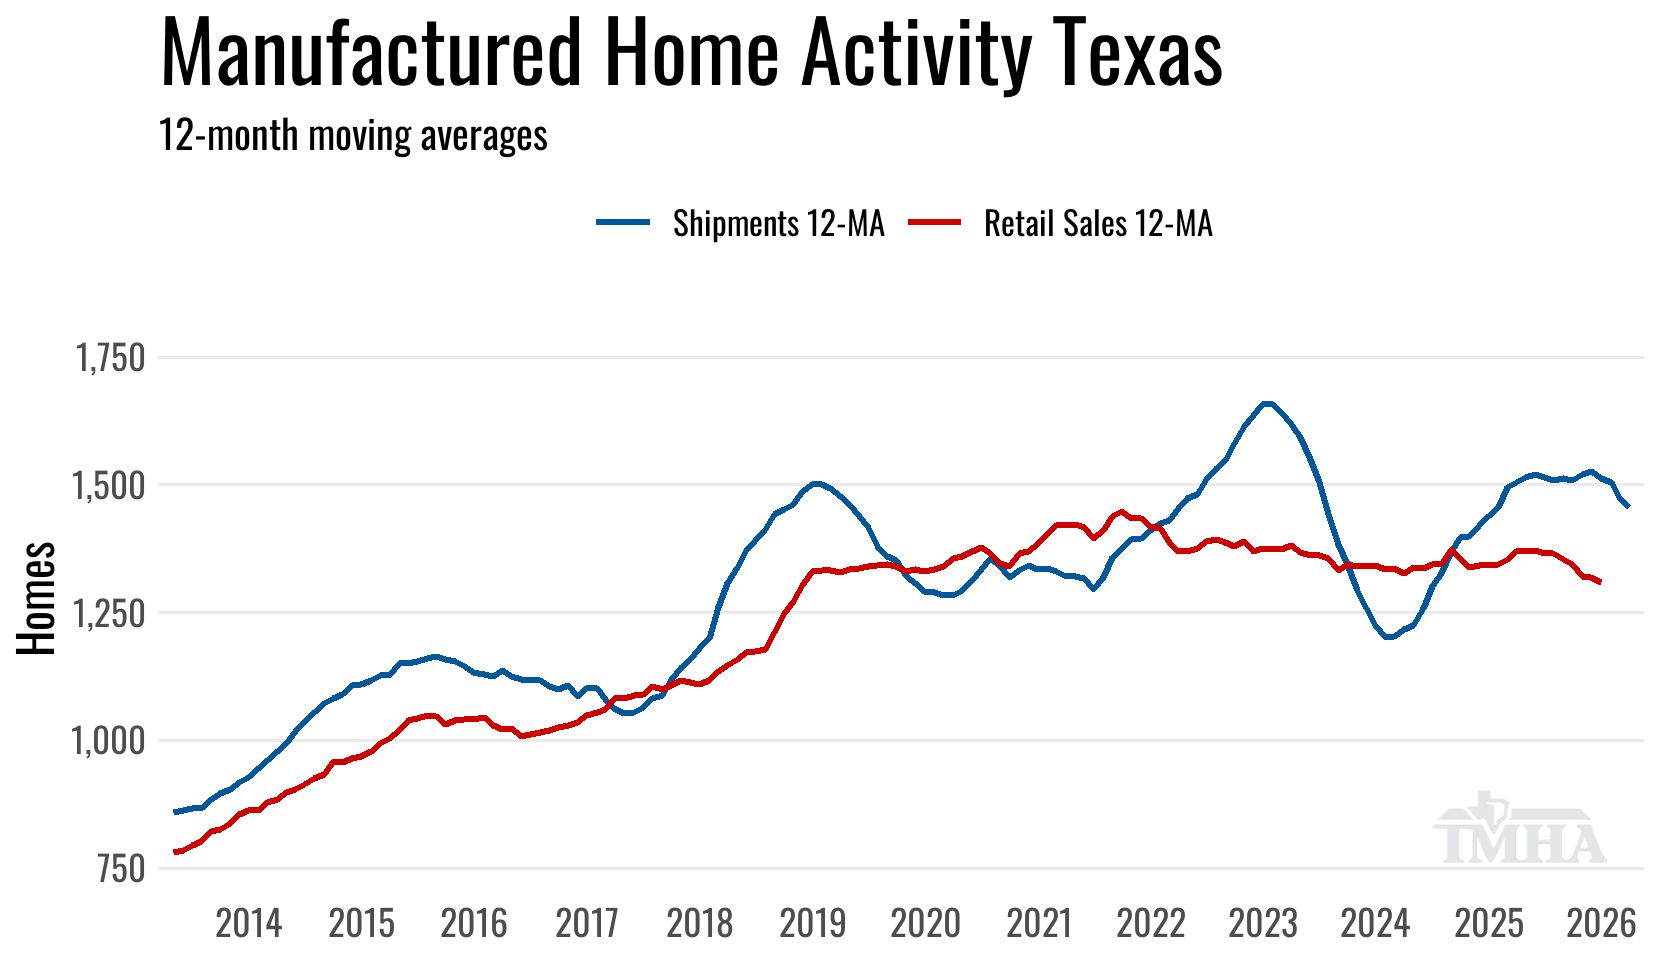
The 12-month moving average for shipments peaked in July of 2025 for this last production expansion cycle and has been moving lower through November.
The 12-month moving average for retail sales is currently plotted through August, late title work will push the last few months higher but not to the extent that it has in prior years.
Year to Date
Shipments
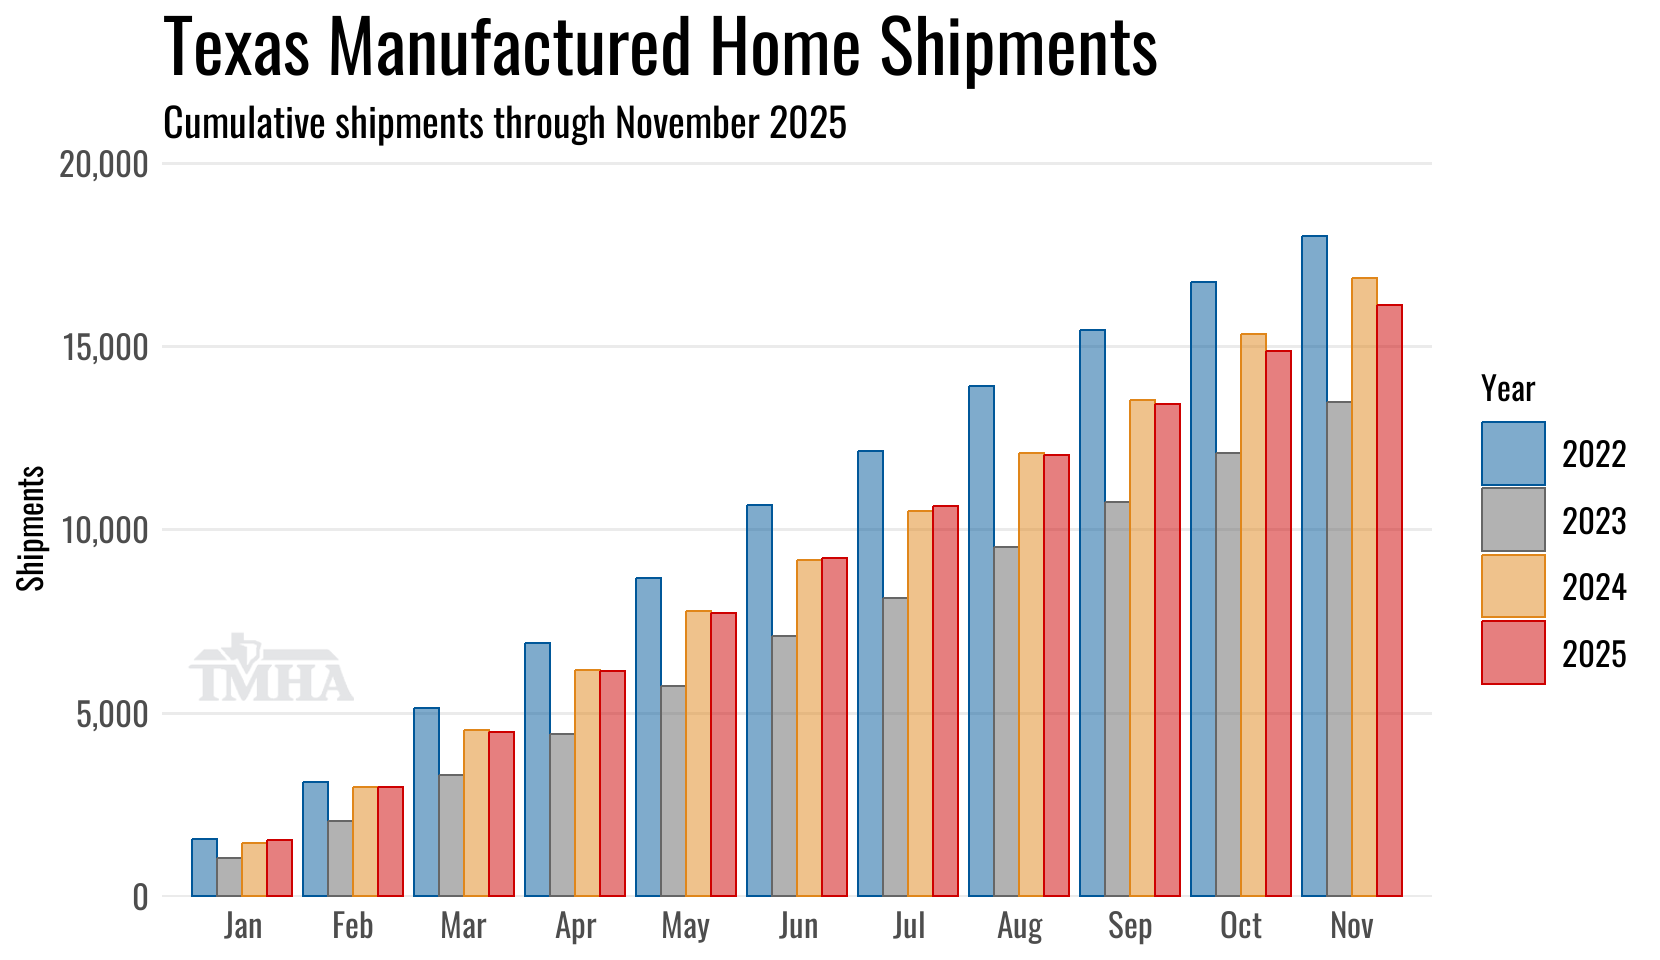
The shipment total for the year has now moved 4.3% below 2024 as an expansion in multi-section units headed to Texas retailers hasn’t been as large as the contraction in single-section shipments across the state.
The forecast for annual Texas shipments in 2025 moved down to 17,262 (+/- 205), that amount would put the year 5% below 2024’s shipment total.
| Shipments | Singles | Multis | Total |
|---|---|---|---|
| Total for 2025 YTD: | 6,472 | 9,650 | 16,122 |
| Change from 2024 (%): | -12.8% | 2.4% | -4.3% |
| Change from 2024 (Units): | -953 | 228 | -725 |
Production
Texas plant total home production moved down 3.4% on the year and the minimum floors built year-over-year is 1.9% below 2024.
The forecast for annual Texas plant production moved down to 21,899 (+/- 233), predicting a 4% decline from the 2024 production total.
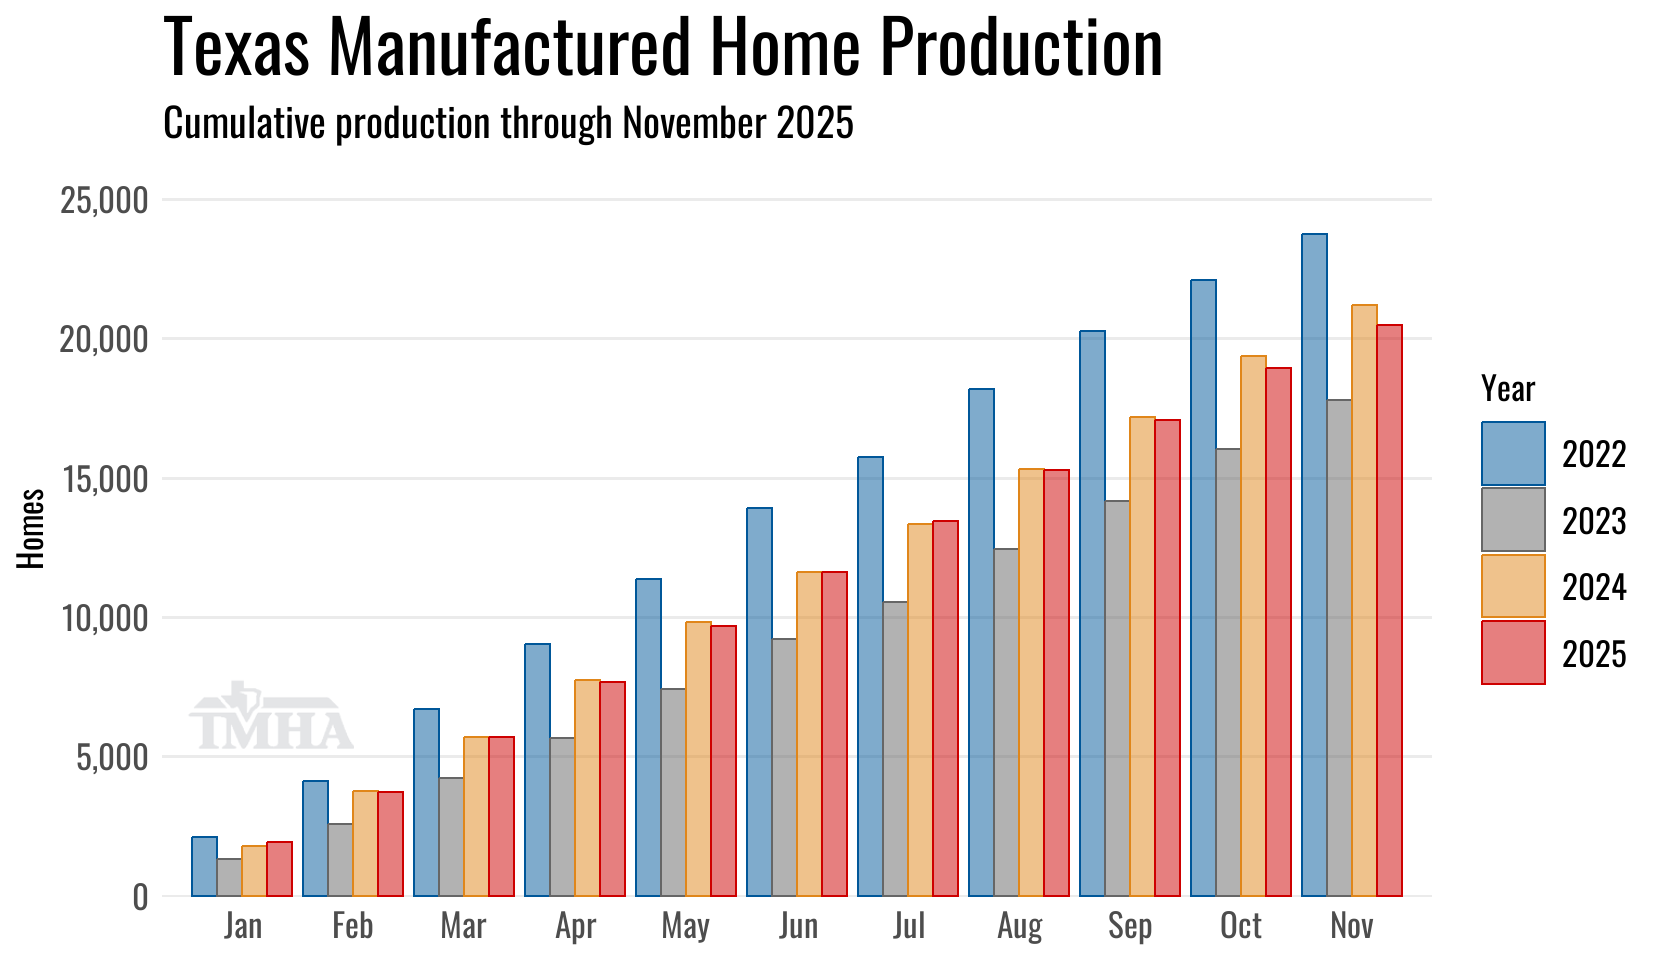
| Texas Plant Production | Total | Shipped Out of TX | Min Floors |
|---|---|---|---|
| Total for 2025 YTD: | 20,484 | 5,463 | 29,315 |
| Change from 2024 (%): | -3.4% | 0.5% | -1.9% |
| Change from 2024 (Units): | -713 | 28 | -559 |
Annual Totals
