Texas Manufactured Home Shipments Report April 2026 - Market Analysis & Data
Rob Ripperda
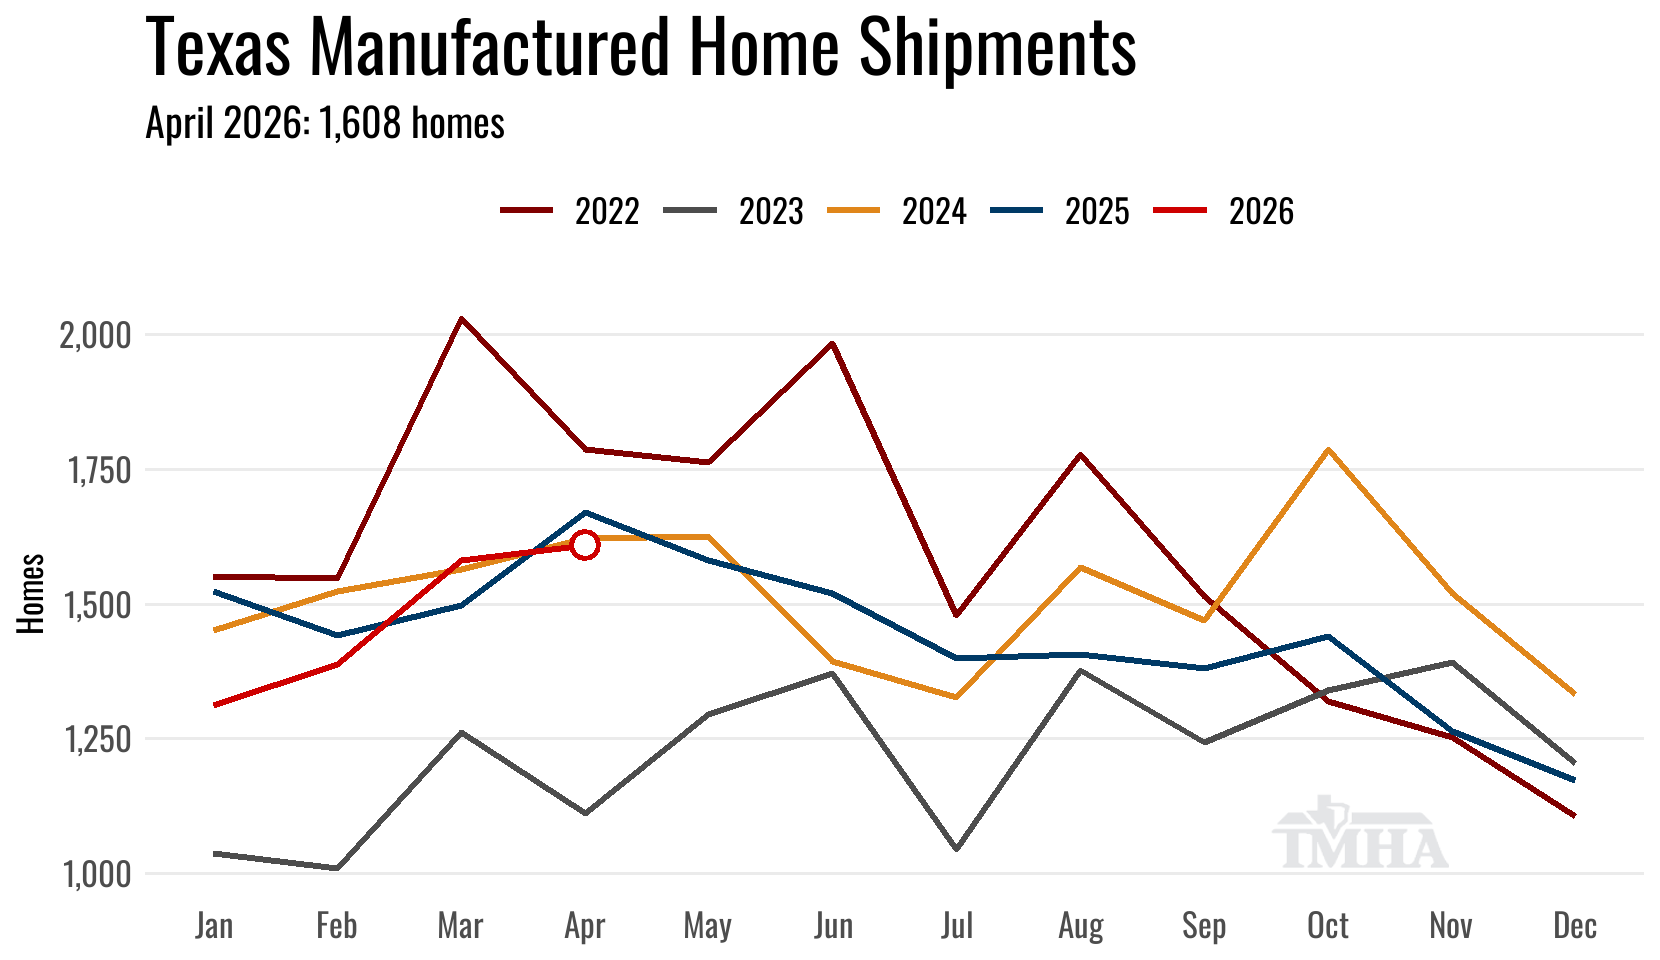
April Shipments
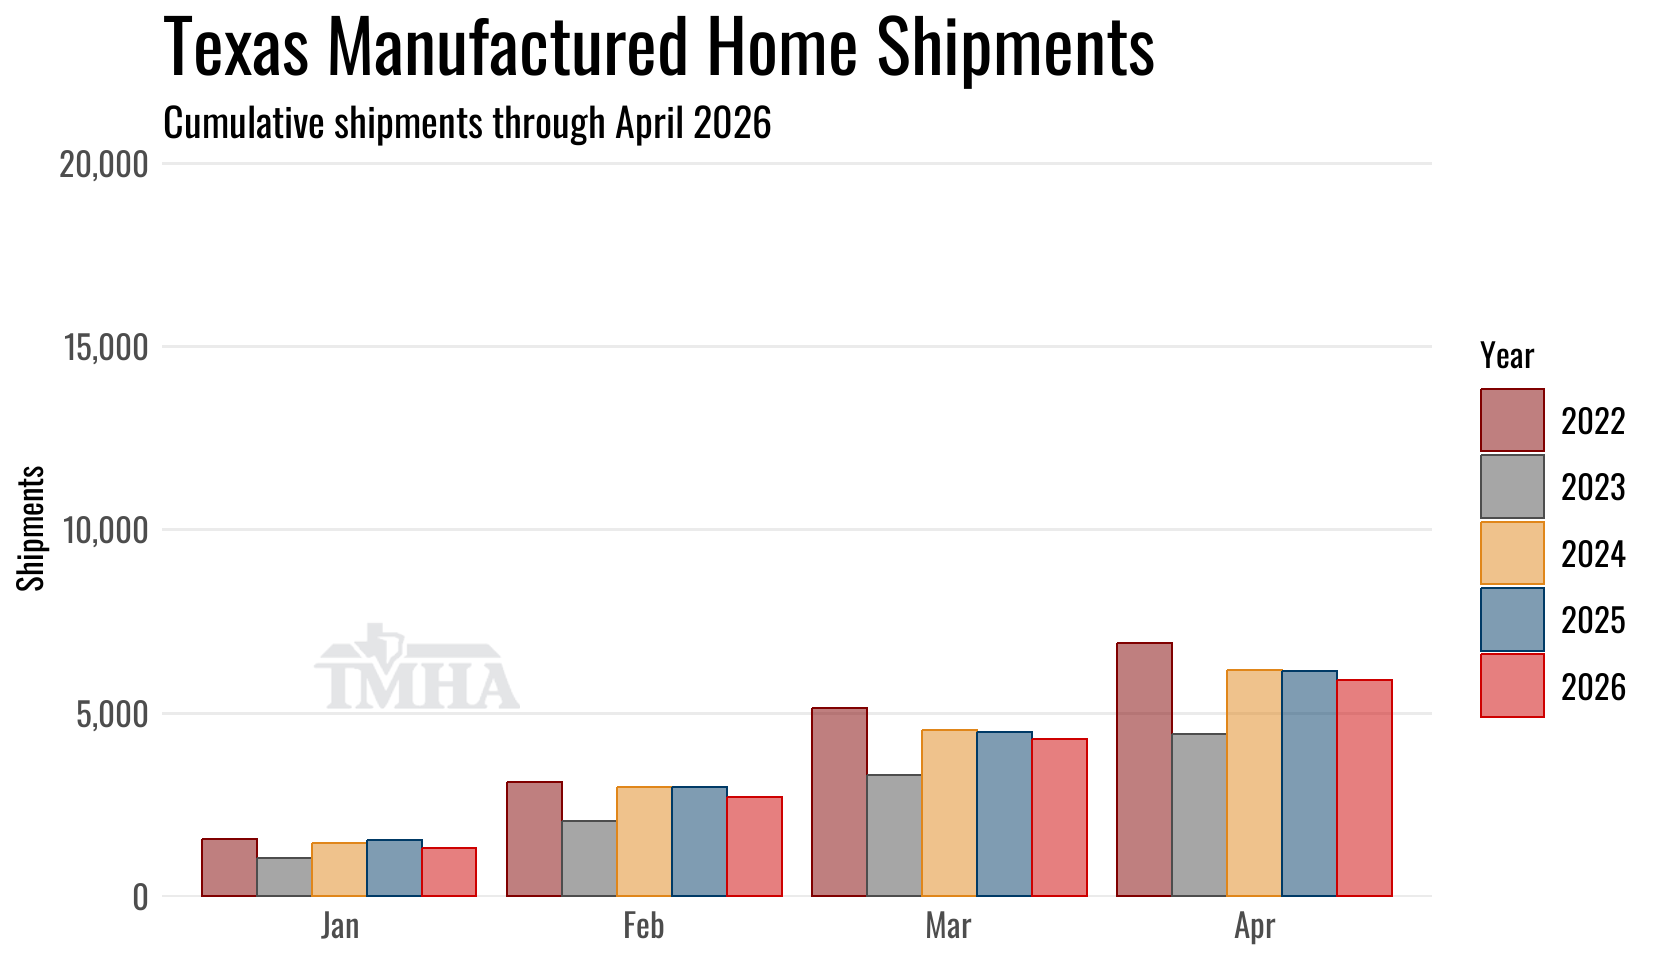
Manufactured home shipments to Texas retailers moved up 0.3% in April on a seasonally-adjusted basis from the prior month. Year over year, shipments were 3.7% below April of 2025, but were very near 2024’s total. The rate of homes shipped to Texas retailers per production day hit its highest level since July of 2025.
April marked the second month in a row of shipments above the 1,500 level.
The 1,608 total homes shipped for the month landed in the upper half of the prediction interval at 82 homes above the point forecast from last month.
| Shipments | Singles | Multis | Total |
|---|---|---|---|
| Total for April: | 605 | 1,003 | 1,608 |
| Change from March (Raw %): | 3.1% | 1% | 1.8% |
| Change from March (Raw Units): | 18 | 10 | 28 |
| Change from March (SA %): | 1.3% | 0.6% | 0.3% |
| Change from April of 2025 (%): | -10.1% | 0.6% | -3.7% |
| Change from April of 2025 (Units): | -68 | 6 | -62 |
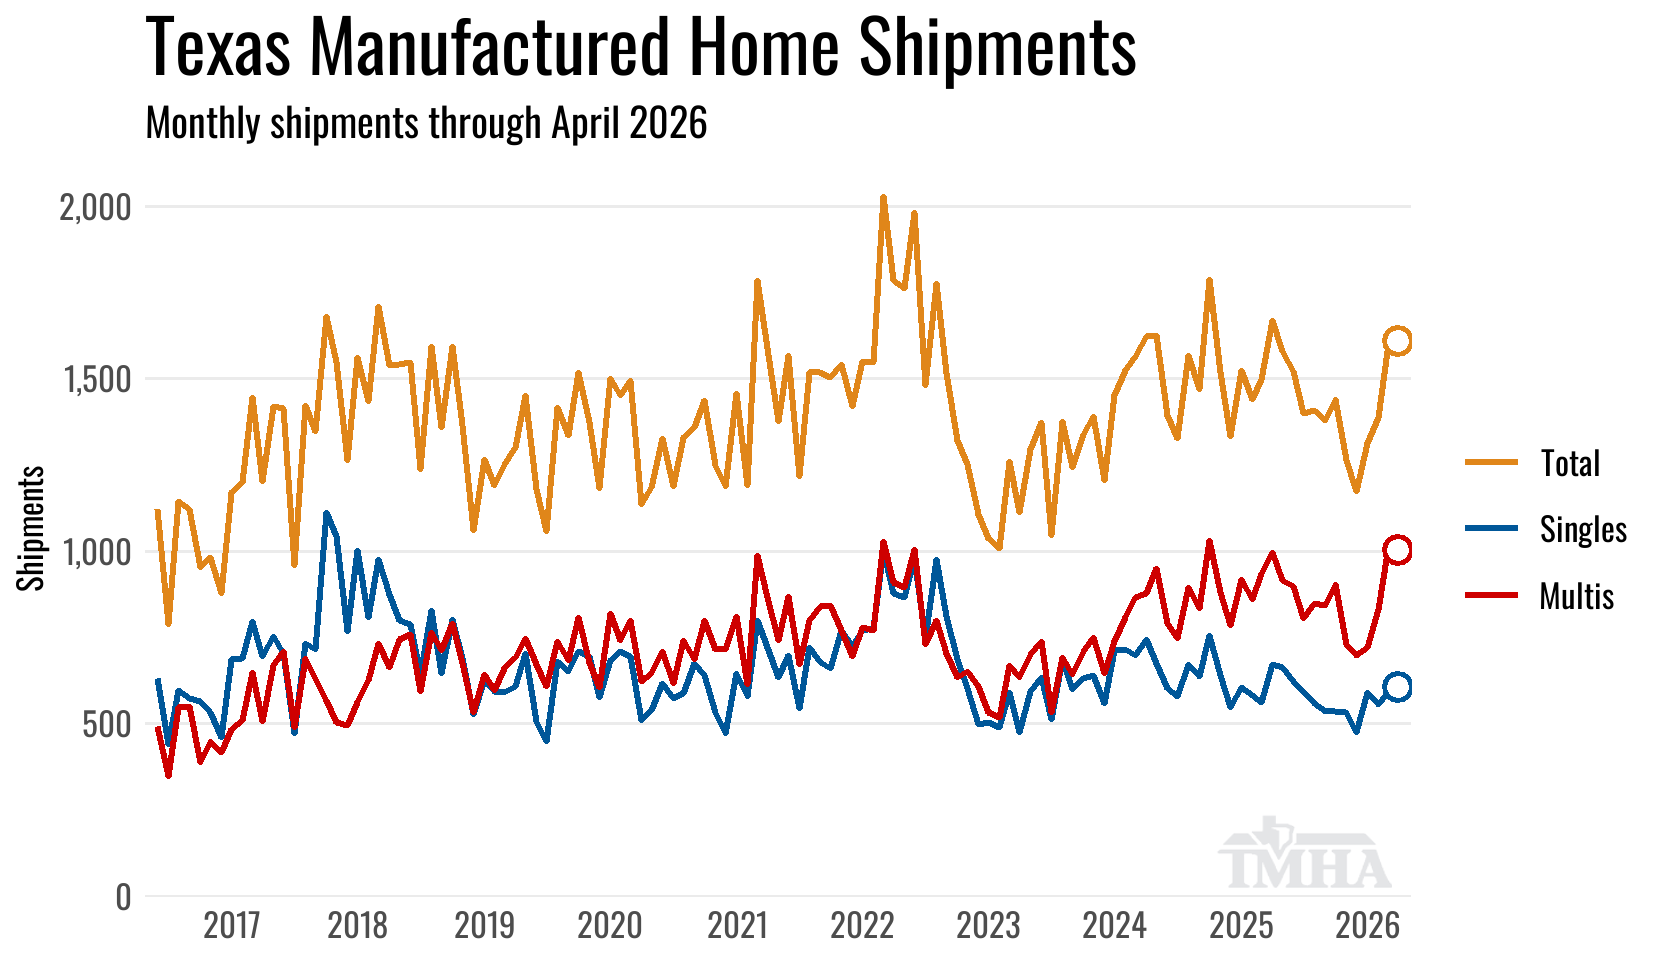
Monthly Manufacturer Shipments
April Production
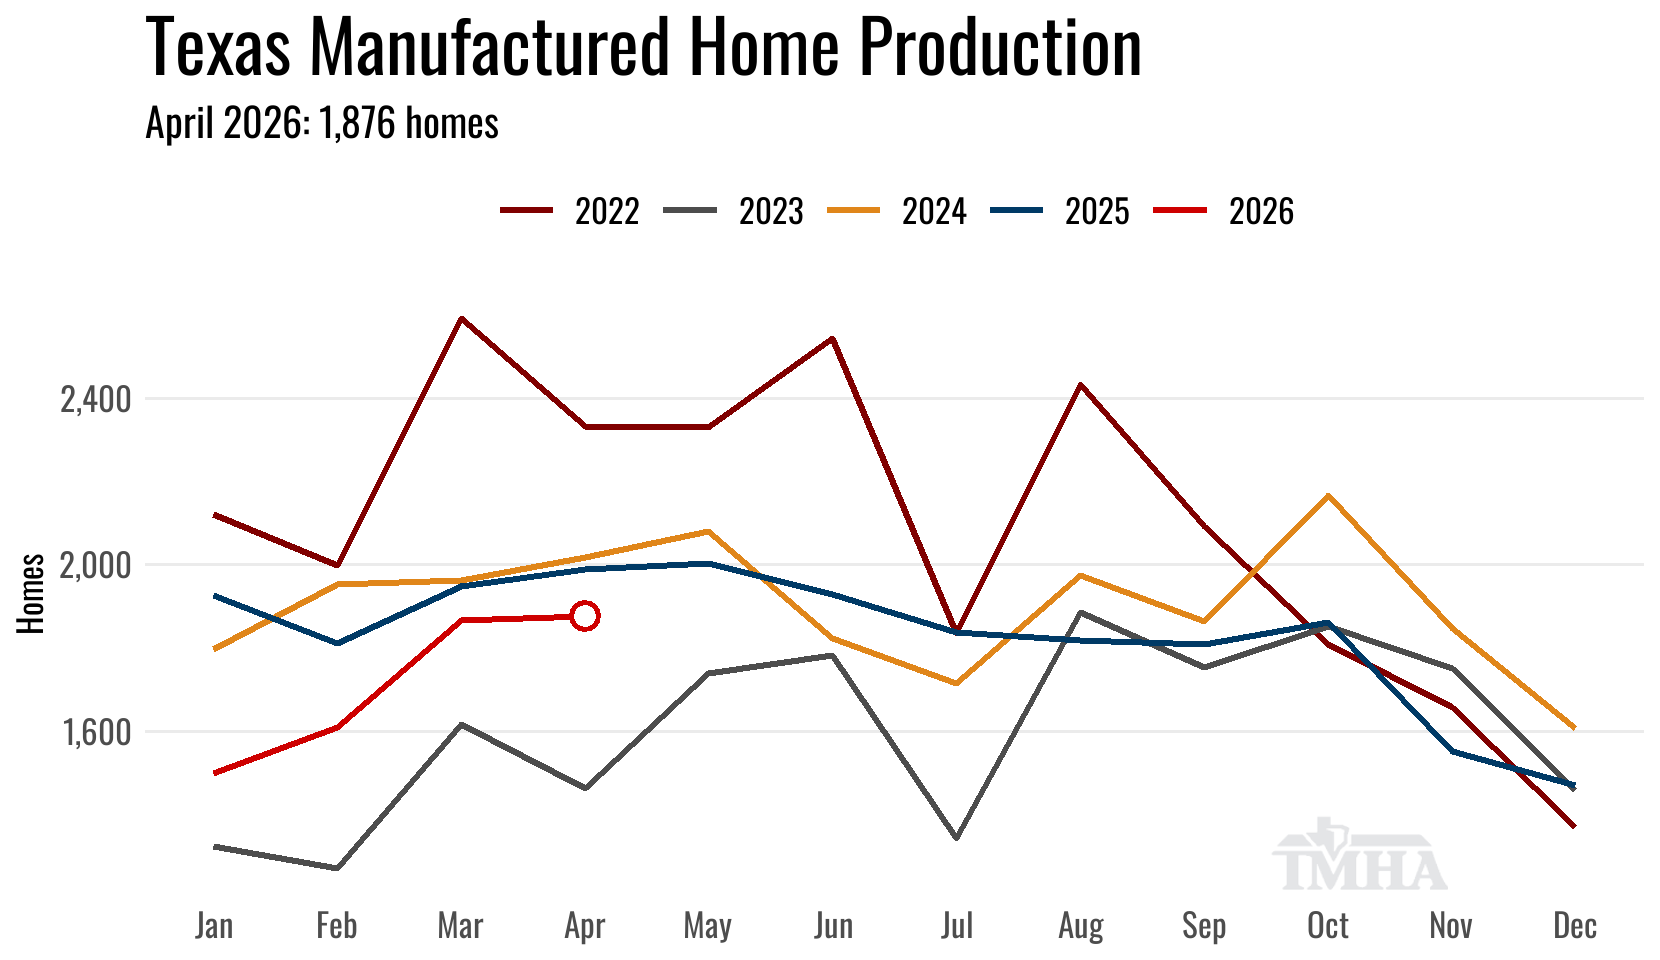
Texas manufactured housing plant production moved up in April 1.3% on a seasonally-adjusted basis from the previous month. The total of homes produced was 1,876 and the minimum number of floors was 2,783.
Year over year, total homes were 5.7% below April of 2025, and minimum floors were 3.2% below the previous year.
The production total landed in the upper side of the prediction interval, 32 homes above last month’s point forecast.
Texas production hit its highest throughput yet for the year in April but reduced deliveries to retailers out of state and a reduction in single-section homes sent to Texas retailers kept April’s total below the two years prior.
| Texas Plant Production | Total | Shipped Out of TX | Min Floors |
|---|---|---|---|
| Total for April: | 1,876 | 397 | 2,783 |
| Change from March (Raw %): | 0.6% | -2.9% | 0.7% |
| Change from March (Raw Units): | 11 | -12 | 20 |
| Change from March (SA %): | 1.3% | NA | 0.9% |
| Change from April of 2025 (%): | -5.7% | -15.5% | -3.2% |
| Change from April of 2025 (Units): | -113 | -73 | -92 |
Monthly Manufacturer Shipments
May Outlook
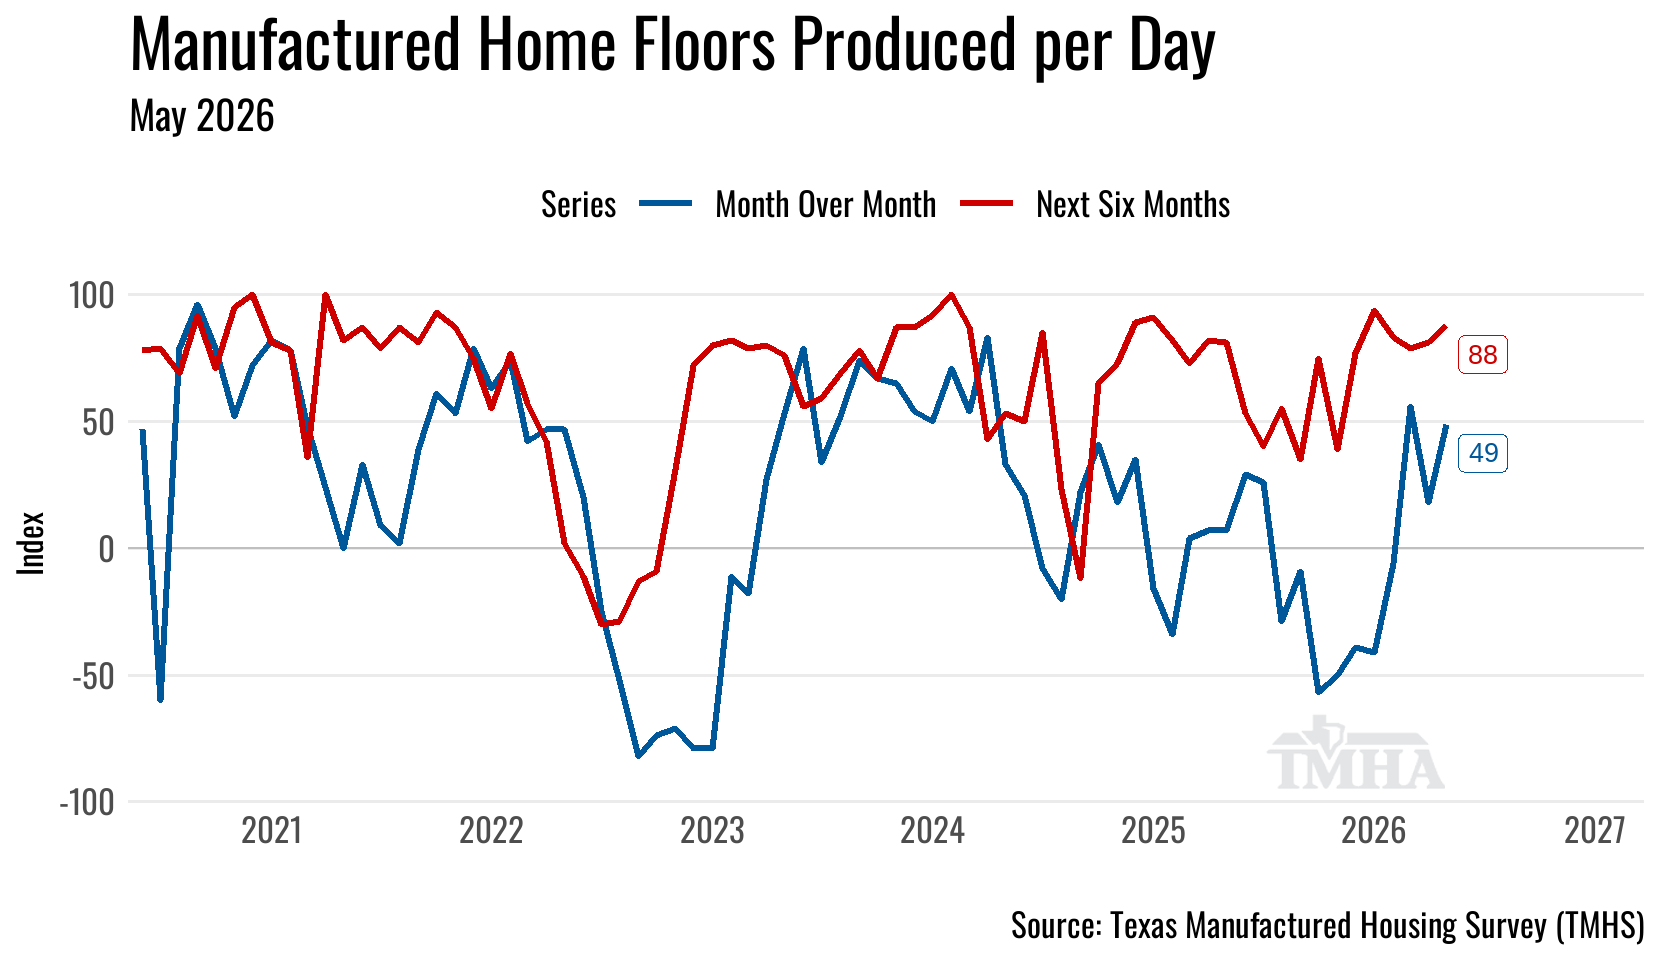
The forecasting models point to May shipments around 1,486 (1,274–1,699) and Texas factory production around 1,718 (1,494–1,942).
The Texas Manufactured Housing Survey (TMHS) signaled a broad increase in run rates for May.
Both forecasts look like coin flips.
Texas Manufactured Home Survey Results
Retail Sales Comparison
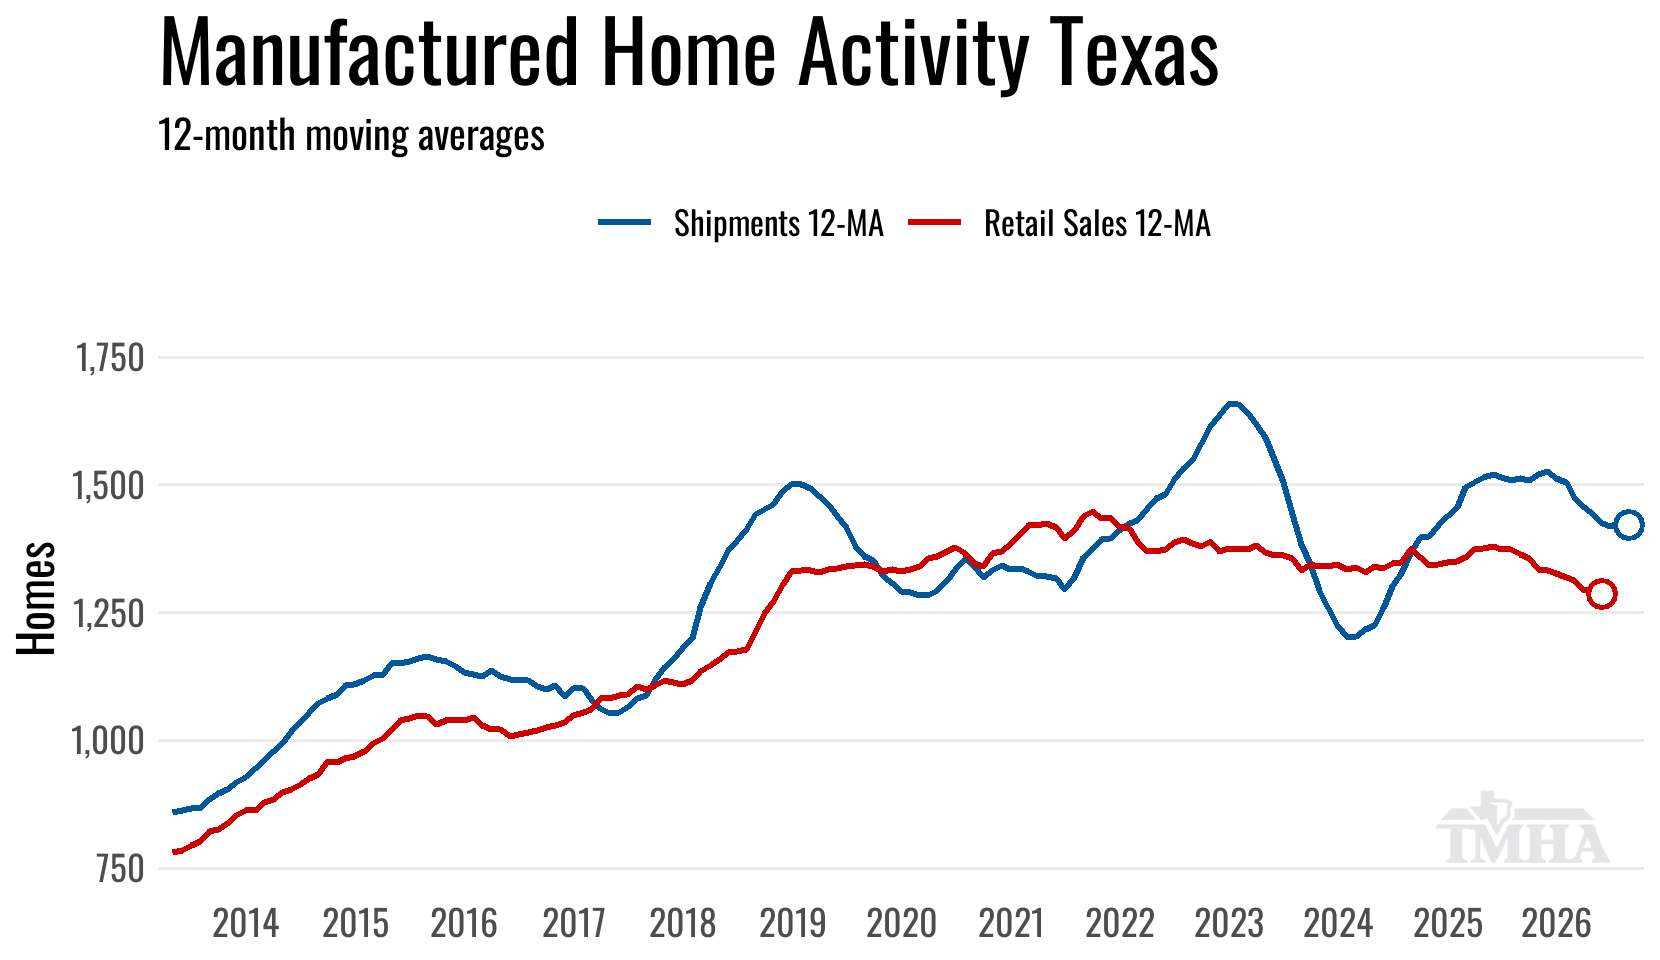
The 12-month moving average for shipments peaked in July 2025 for this production expansion cycle and has been moving lower since with the exception of March 2026.
The 12-month moving average for retail sales is currently plotted through January 2026. Late title work will continue to push the most recent months higher, though not to the extent seen in prior years.
Year to Date
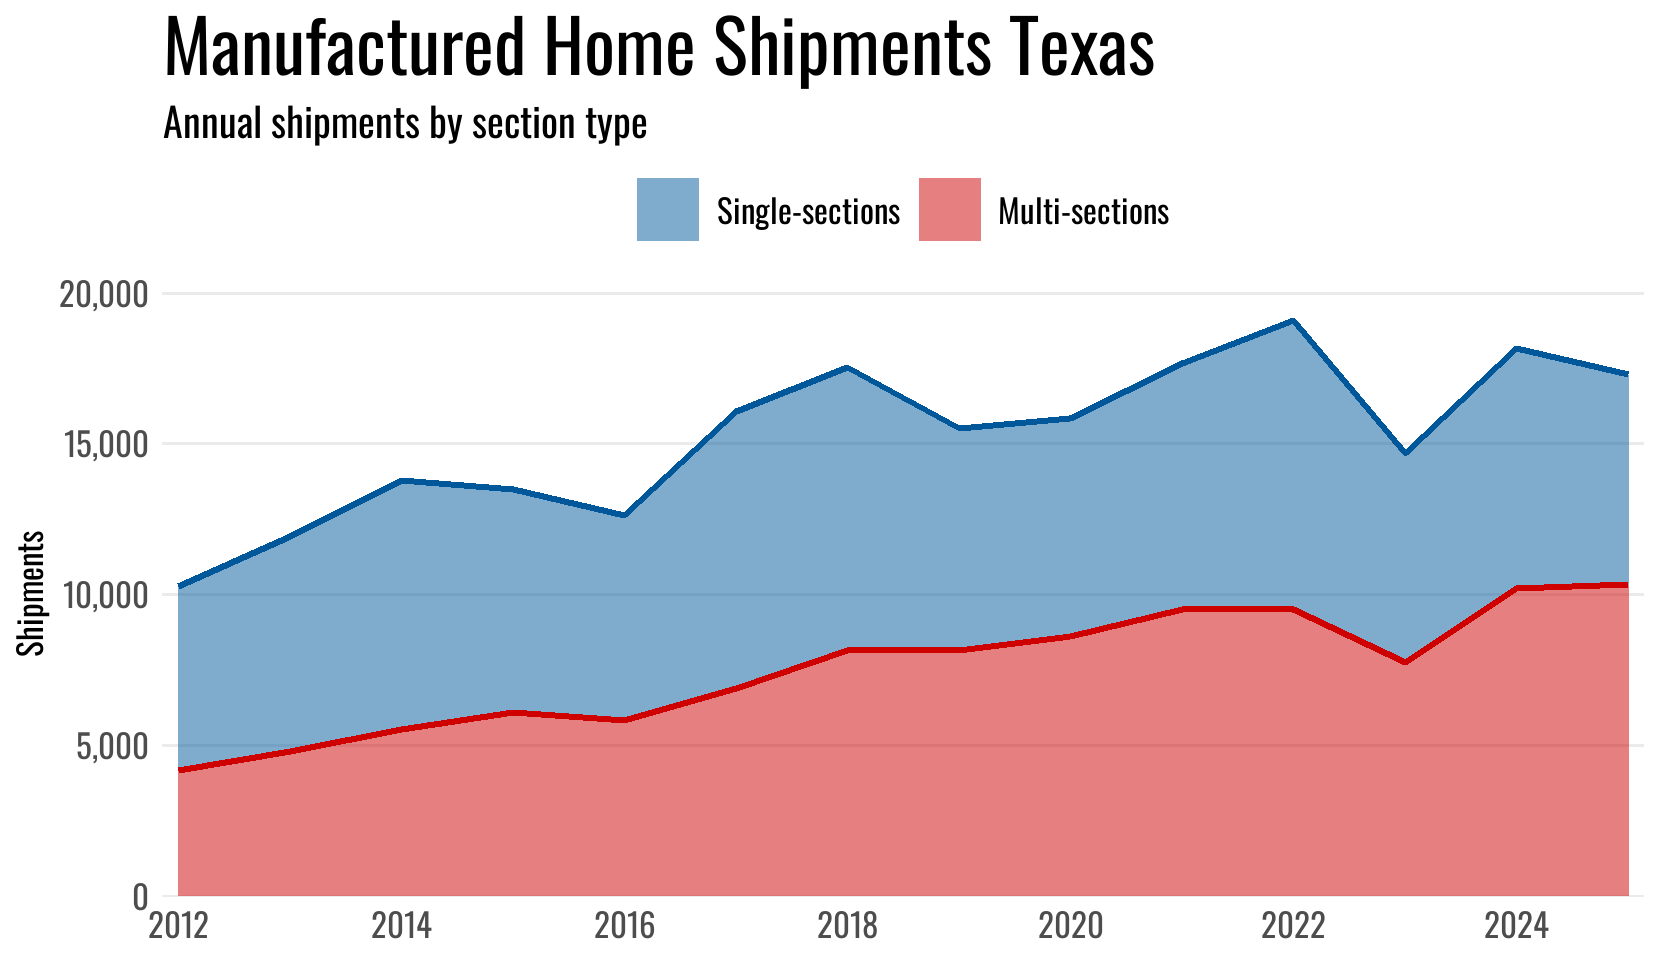
Shipments
Shipments for the year are 4% below 2025.
The forecast for 2026 Texas shipments moved up to 17,649 (15,564–20,032).
| Shipments | Singles | Multis | Total |
|---|---|---|---|
| Total for 2026 YTD: | 2,339 | 3,549 | 5,888 |
| Change from 2025 (%): | -3.5% | -4.3% | -4% |
| Change from 2025 (Units): | -85 | -159 | -244 |
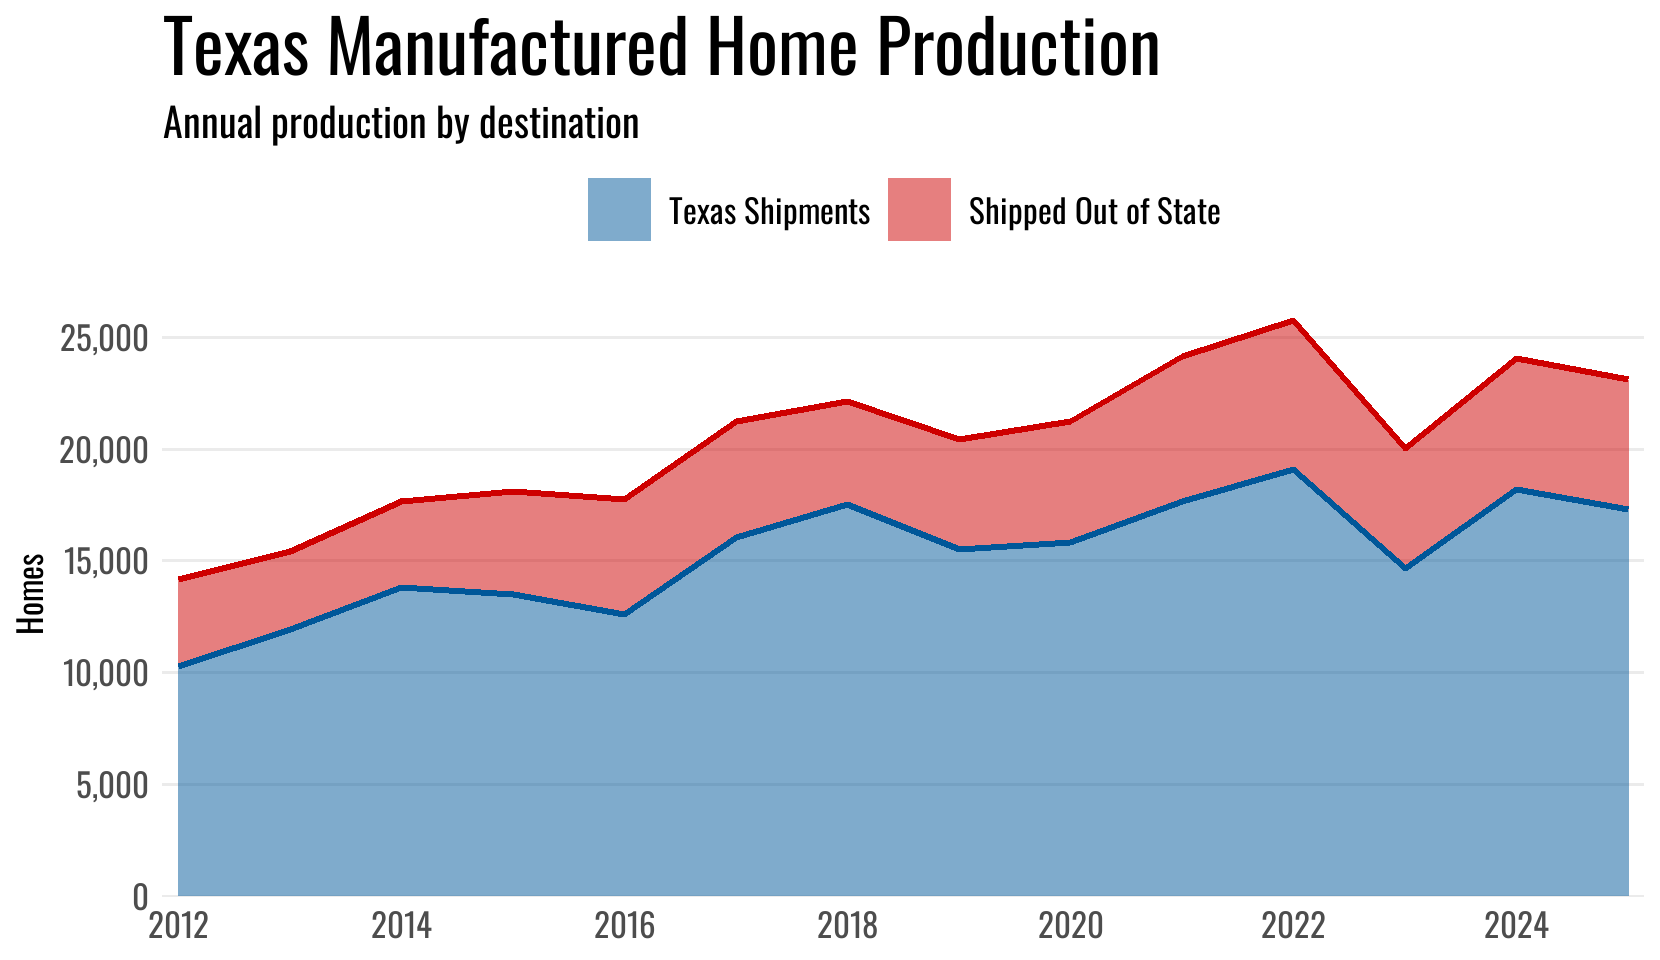
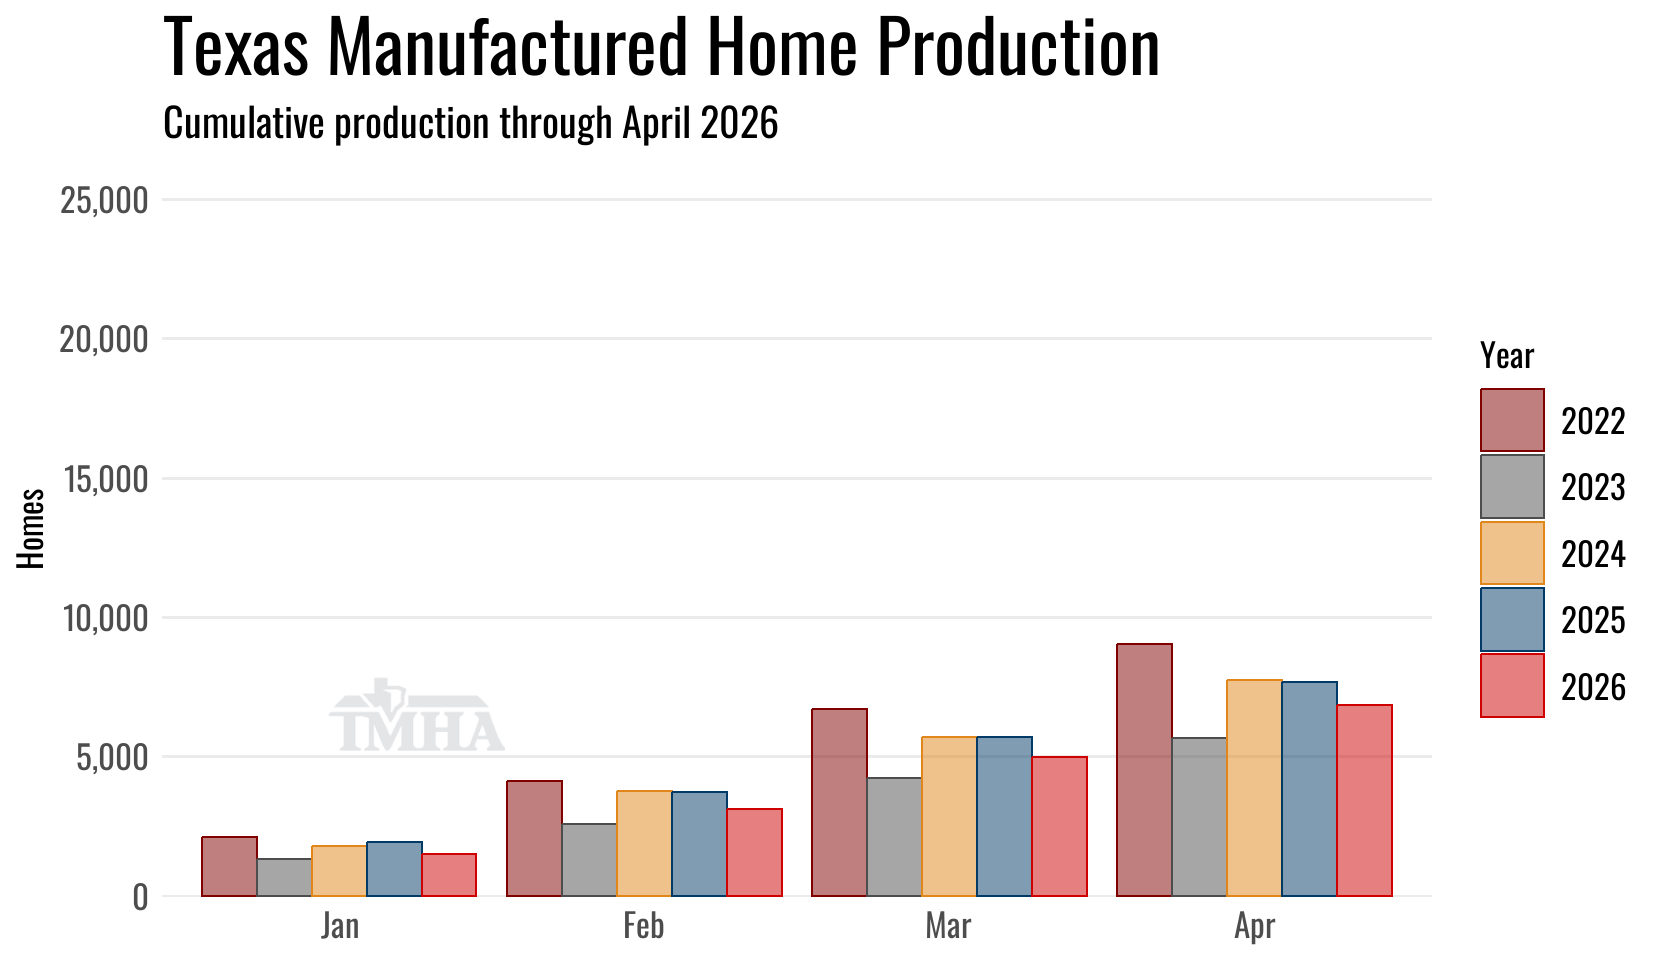
Production
Texas plant total home production for 2026 is 10.8% below the previous year and the minimum floors built are 9.1% below 2025.
The forecast for 2026 Texas plant production moved up to 20,868 (18,521–23,432).
| Texas Plant Production | Total | Shipped Out of TX | Min Floors |
|---|---|---|---|
| Total for 2026 YTD: | 6,849 | 1,503 | 10,054 |
| Change from 2025 (%): | -10.8% | -24.4% | -9.1% |
| Change from 2025 (Units): | -827 | -486 | -1,011 |
Annual Totals