Texas Manufactured Home Shipments Market Analysis
March Shipments
Manufactured home shipments to Texas retailers moved up sequentially in March by an unadjusted +2.7% over the previous month. The seasonally-adjusted numbers are showing a decline, but the additional leap day in February coupled with how the weekday calendar aligned in March gave both months the same numbers of business days and masks what was a slight expansion.
The 1,564 homes shipped was a +24% increase over March of 2023.
| Shipments | Singles | Multis | Total |
|---|---|---|---|
| Total for March: | 697 | 867 | 1,564 |
| Change from February (Raw %): | -2.4% | 7.2% | 2.7% |
| Change from February (Raw Units): | -17 | 58 | 41 |
| Change from February (SA %): | -5.6% | -2.3% | -3.8% |
| Change from March of 2023 (%): | 17.7% | 29.6% | 24% |
| Change from March of 2023 (Units): | 105 | 198 | 303 |
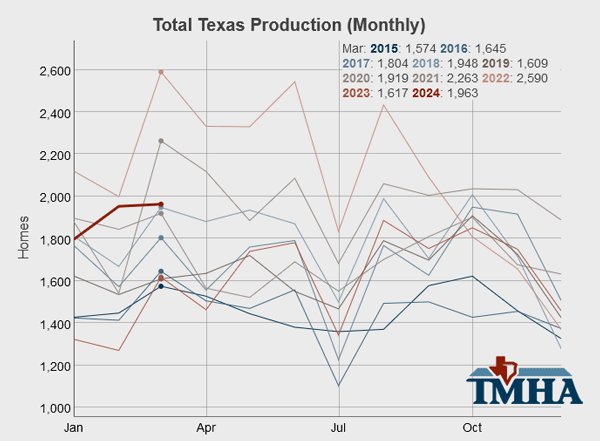
March Production
Texas manufactured housing plant production moved up +0.5% in March over the previous month for total number of homes, and was up +2.1% when looking at min number of floors.
The raw total of 1,963 homes was a +21.4% increase over March of 2023.
Shipments to out of state retailers remain elevated on a year-over-year basis.
| Texas Plant Production | Total | Shipped Out of TX | Min Floors |
|---|---|---|---|
| Total for March: | 1,963 | 508 | 2,765 |
| Change from February (Raw %): | 0.5% | 0% | 2.1% |
| Change from February (Raw Units): | 10 | 0 | 58 |
| Change from February (SA %): | -2.5% | NA | -2.2% |
| Change from March of 2023 (%): | 21.4% | 23.9% | 22.8% |
| Change from March of 2023 (Units): | 346 | 98 | 514 |
April Outlook
The forecasting models have April shipments at 1,555 (+/- 217) and Texas factory production at 2,026 (+/- 231) homes.
The Texas Manufactured Housing Survey (TMHS) for April signaled further increases in run rates and while I have tweaked the models to better account for the number of production days in the month I would still take the over on the shipment total.
The production total is very near a coin flip with a slight lean towards the over.
Annual Totals
The shipment total for 2024 is currently up +37.2% over 2023 and Texas plant production is up +35.7%.
The forecast for annual Texas shipments in 2024 moves down to 17,499 (+/- 2,552) and forecasted Texas plant production moves down slightly to 23,031 (+/- 2,860). The downward movement in the forecasts should be due to March not having the typical bump up in production days so I expect the forecasts to bounce back up with next month’s release.
| Shipments | Singles | Multis | Total |
|---|---|---|---|
| Total for 2024 YTD: | 2,124 | 2,414 | 4,538 |
| Change from 2023 (%): | 33.9% | 40.2% | 37.2% |
| Change from 2023 (Units): | 538 | 692 | 1,230 |
| Texas Plant Production | Total | Shipped Out of TX | Min Floors |
|---|---|---|---|
| Total for 2024 YTD: | 5,712 | 1,462 | 7,941 |
| Change from 2023 (%): | 35.7% | 40% | 35.4% |
| Change from 2023 (Units): | 1,502 | 418 | 2,076 |
Charts
In this chart you can see that when the shipment moving-average crosses the retail sales moving-average a turn in shipments usually follows. The last downward cross occurred in June of 2019 and it’s not too hard to see that shipments were headed back up for the upward cross in March of 2020, right when COVID-19 hit and strangled production for several months. It is that unprecedented stretch of retail sales above shipments from June of 2019 through August of 2021 that I think best explains the huge expansion in shipments we see after that point that peaked in August and September of 2022.